Storyboard · WvN02

Living Maps: From Cosmos to Community

What makes our communities livable and resilient? Through 3D visualization in the immersive GeoDome Theater, audiences explored the conditions that support life, from the outer edges of the solar system to their own communities in the Appalachian Mountains of Western North Carolina. Understanding these conditions can inform strategies for addressing interconnected challenges in this region.

Premiered
September 29, 2011
Venue
Land of Sky Regional Council
Scenes
44
Last revised
August 21, 2014

Web version · Original script and storyboard (Google Doc) »

01

What cosmic conditions make Earth livable?

6 scenes
Scene 1.1, frame 1
Scene 1.1

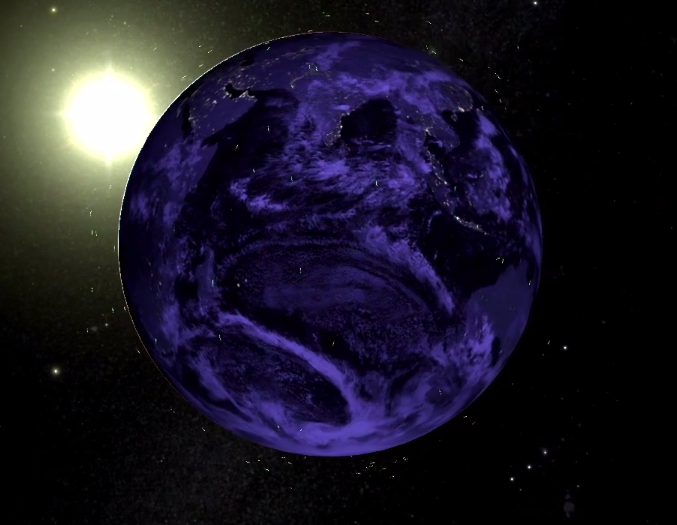
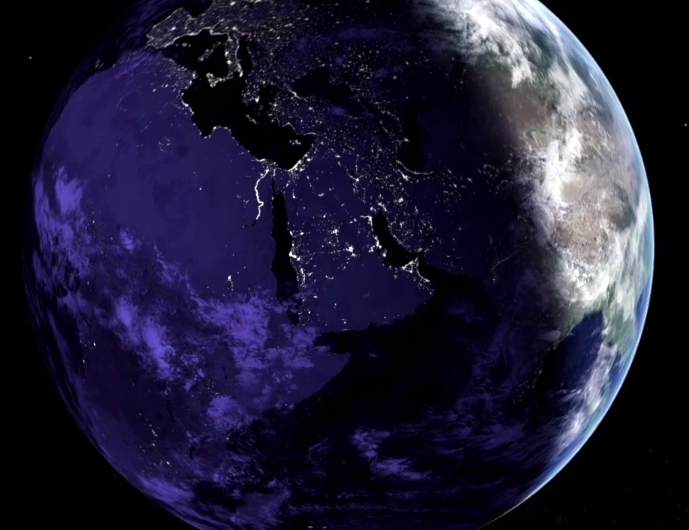
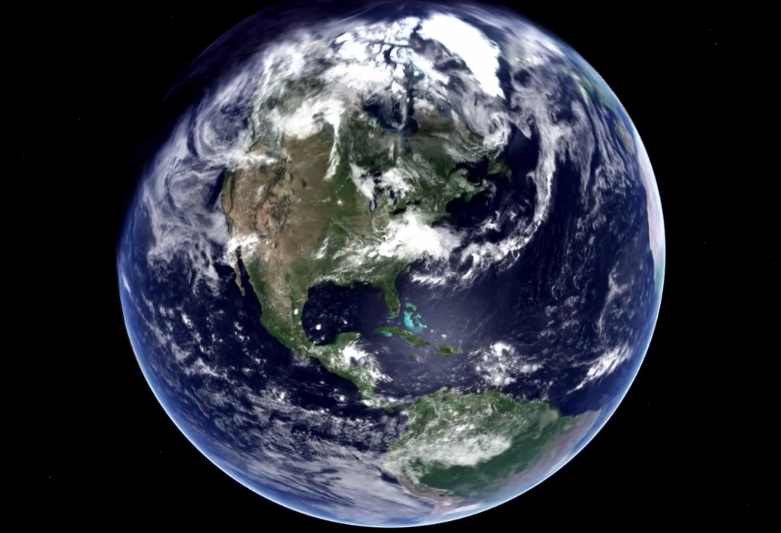
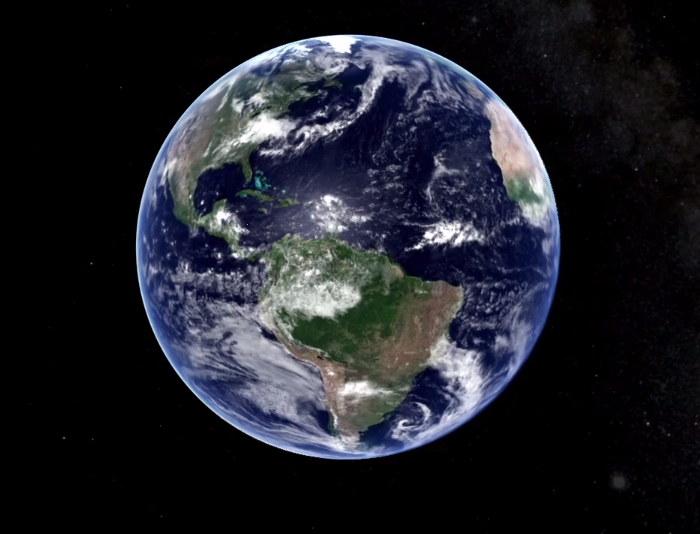
Most of us are quite familiar with this view of our home planet from space.

But our ability to see Earth from this perspective is something quite new in the history of humanity.

In the past 50 years, we’ve launched hundreds of satellites, which have enabled us to extend our perceptions and study ourselves like never before.

Uniview cues
Uniview Controls:
Turn off time
Start with a View of Earth
Sources

http://vimeo.com/50850191

http://vimeo.com/50850191

Scene 1.2, frame 1
Scene 1.2

As a result, we've gained a deeper appreciation of the many ideal conditions and interacting forces that support life on our home planet.

And it seems the more we study this place, the more we realize how extraordinary it actually is.

In the next few minutes, we're going to explore maps of scientific data that allow us to visualize normally invisible interactions that that make life on earth possible.

Uniview cues
Object Tree:
Turn on Satellites
Scene 1.3, frame 1
Scene 1.3

For instance, the Earth’s magnetic field is usually only visible as the aurora borealis. But here we can see that it actually extends far into space, blown back by the solar winds of the sun.

It wasn’t until scientists began studying this with satellites that they realized that the magnetosphere protects the gases of our atmosphere from rapidly being blown away into space.

Uniview cues
Object Tree:
Turn on Magnetosphere
Scene 1.4, frame 1
Scene 1.4

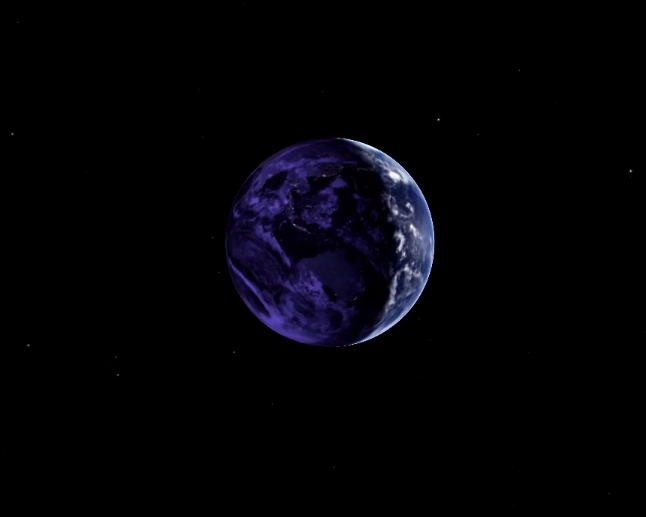
Similarly, we now know that the Earth’s tilt and rotation are why varying amounts of sunlight are received at different latitudes throughout the year.

This creates the conditions for different seasons that enable the annual cycles of life on many parts of our planet.

Uniview cues
Uniview Controls:
Orbit around Earth
Sources

NOAA Climate literacy principles: 1c, 1d, 1e.

Scene 1.5, frame 1
Scene 1.5

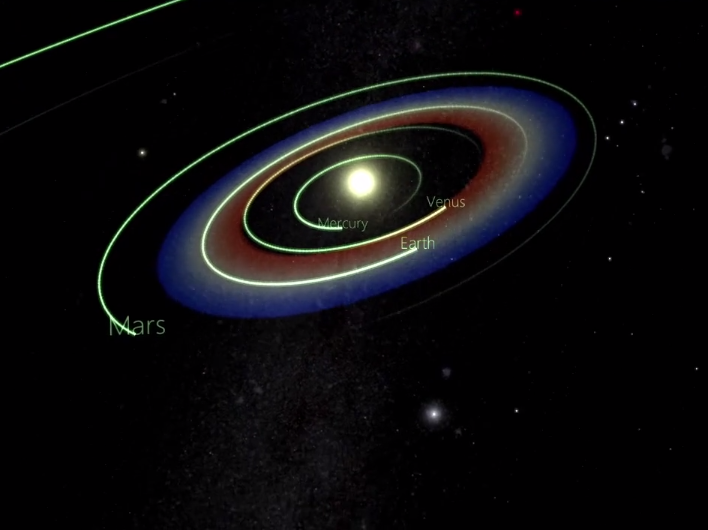
And as we pull back even further, we can see that Earth’s distance from the sun is just right so that that water on its surface doesn’t permanently evaporate or freeze.

Since liquid water is necessary to support life as we know it, we are in what is sometimes called the Habitable Zone, or even the Goldilocks Zone, since the temperature here is neither to hot nor too cold.

And fortunately for us, Earth is the only one of all the planets in our solar system within this zone.

Uniview cues
Object Tree:
Turn on Solar System Habitable Zone
Sources

NOAA Climate literacy principles: 1b

Scene 1.6, frame 1
Scene 1.6

There’s actually a quite a bit water in the solar system, it’s just that most of it is locked up in belts of frozen asteroids and comets, seen here in the asteroid belt.

We believe that the water on Earth originally came from these icy rocks crashing into our planet billions of years ago.

Uniview cues
Object Tree:
Turn on Kuiper Belt and Oort Cloud
02

The Hydrosphere: The Blue Planet

2 scenes
Scene 2.1

Today, Earth’s surface is dominated by water, with oceans covering about two-thirds of it’s surface.

The oceans help to absorb large amounts of solar energy and redistribute heat and water vapor around the globe.

Uniview cues
Uniview Controls:
Rotating Earth
Sources

NOAA Climate literacy principles: 2b

Scene 2.2, frame 1
Scene 2.2

Yet the amount of fresh water available for consumption is limited.

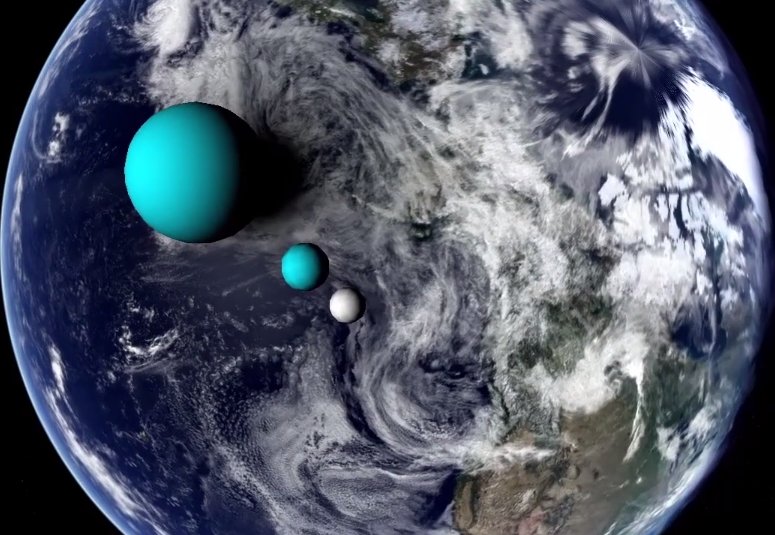
To help us imagine this, we can visualize this sphere that represents the total volume of water on planet Earth.

But only a fraction of this is fresh water, represented by this second sphere, and the majority of this is locked up in ice, seen here as a white sphere.

Many human societies rely on ground water, since the surface water from lakes, swamps, and rivers make up only a tiny fraction of the global water supply.

Uniview cues
Object Tree:
Turn on Water Spheres
03

The land

1 scene
Scene 3.1

It’s the availability of fresh water that primarily determines the livability of different regions around the world.

The varying green, brown, and white areas help us to see where vegetation, deserts, and ice cover the land.

This also gives us insights into the habitability of different places.

Uniview cues
Uniview Controls:
Return to Blue Marble
Sources

NOAA Climate literacy principles: 3c

04

Human Footprint

1 scene
Scene 4.1, frame 1
Scene 4.1

And of course, human civilizations have long been established in places where water is easily accessible.

For instance, when we look at this map of lights at night, we can see how the largest settlements in northern Africa are along the banks of the Nile river.

But this also demonstrates how humanity is using so much electricity that our presence on Earth can now be actually be seen from space.

Uniview cues
Uniview Controls:
Scroll around to show the lights at night
05

The Atmosphere

1 scene
Scene 5.1, frame 1
Scene 5.1

And the ways in which we’re generating all of this power is changing our planet’s atmosphere.

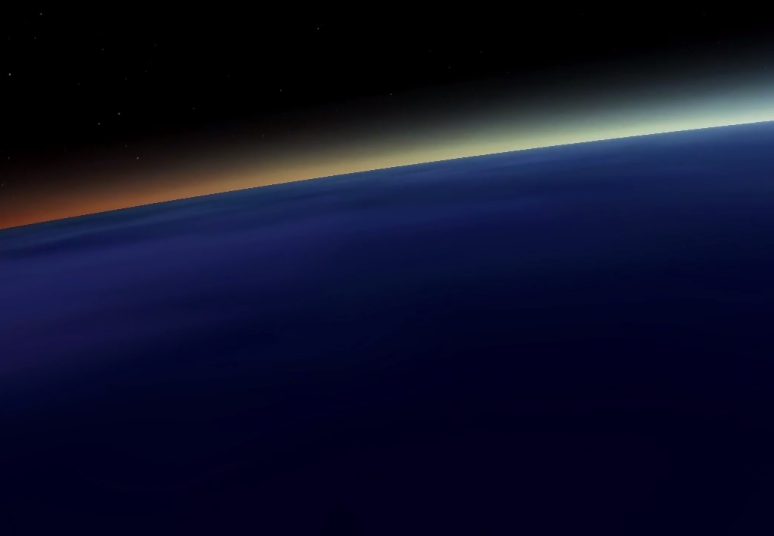
This thin layer of gases - seen here as a blue line around the planet - is roughly equivalent to width of an apple skin to an apple. It’s held in place by gravity and, as we have seen, protected by the magnetosphere.

Over the past 10,000 years, the composition of these atmospheric gases has been been relatively stable, maintaining temperatures in many parts of the world that have enabled the rapid growth of human civilization.

Yet as we’ve burned more and more fossil fuels in the past century, we’ve been rapidly injecting heat-trapping gases into the atmosphere.

As sunlight reaches the Earth, some of it bounces back into space, but some of its heat is trapped by these so-called greenhouse gases.

A certain amount of these is very useful, since they help to sustain stable temperatures.

However, the introduction of too many greenhouses gases has begun to trap more and more heat and alter the climate.

Uniview cues
Uniview Controls:
Zoom down to show oblique view of Rayleigh scattering in atmosphere
Sources

NOAA Climate literacy principles: 2c, 2d, 2e

06

The Biosphere: Life

1 scene
Scene 6.1

And this, along with our use of land and other natural resources, is having an impact on many of the plants, animals, and other organisms that make up the Earth’s biosphere.

These changes are altering the habitable zones of the planet, forcing plant and animal migrations that are rapidly altering environments around the globe.

It’s more important than ever that we understand these relationships and the role of human activity and decision making in shaping the planet’s ecosystems so we can adapt to these new realities.

Uniview cues
Uniview Controls:
Zoom out to show full planet
07

Southern Appalachia

13 scenes
Scene 7.1, frame 1
Scene 7.1

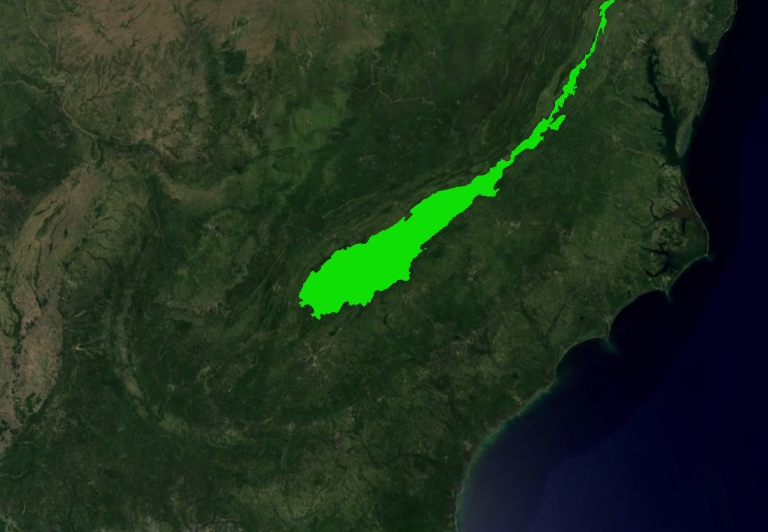
When we look at our own Southern Appalachian Bioregion, we find a unique combination of water, air, land, and biodiversity that naturally makes our region quite special.

Uniview cues
01_WNC_Ecoregion
View from space with bioregion in red outline.
Sources

http://vimeo.com/50851470

http://vimeo.com/50851470

Scene 7.2, frame 1
Scene 7.2

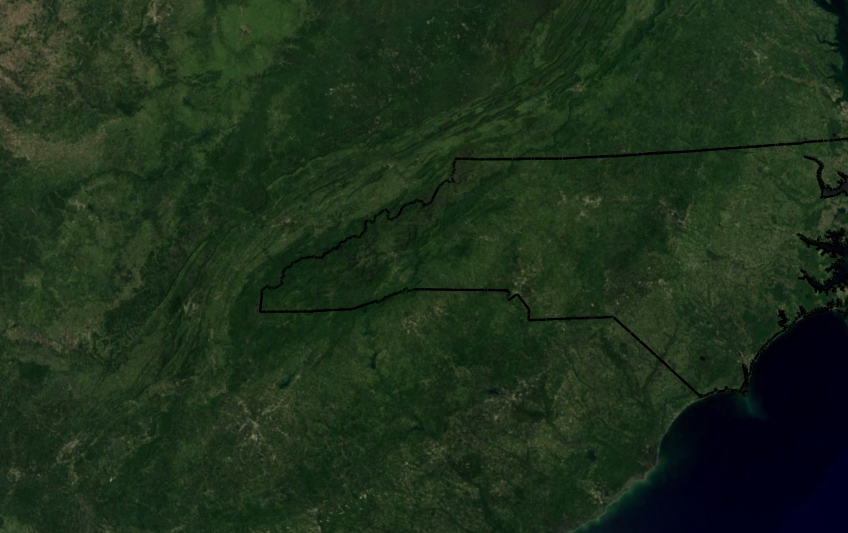
And we’re fortunate to have a long tradition of human settlements that have forged a close relationship with this ancient mountain region.

Studying the history of these settlements can help us gain a greater understanding of where we are, and inform innovative approaches for increasing the health and resilience of both natural and human-built environments.

Uniview cues
02_State_Boundaries
Scene 7.3, frame 1
Scene 7.3

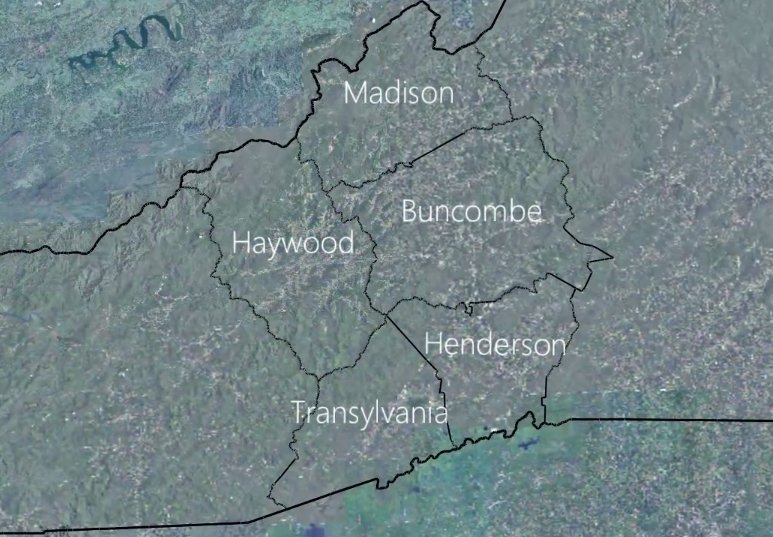
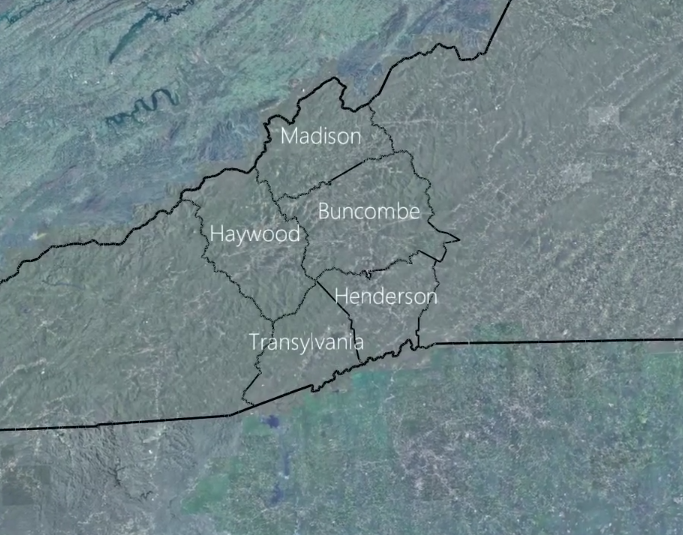
While the state of NC stretches from the Atlantic Coast in the east to the Mountains in the west, we’re going to focus on the five local counties of Transylvania, Henderson, Buncombe, Haywood and Madison.

By zooming in and considering our region from a whole systems perspective, we can better understand the impacts of our local decision making on the broader region.

Uniview cues
03_WNC_Counties.kml
Center WNC on the screen with the imagery. For the next several maps, we will use the layers from the MRC report card.
Scene 7.4, frame 1
Scene 7.4

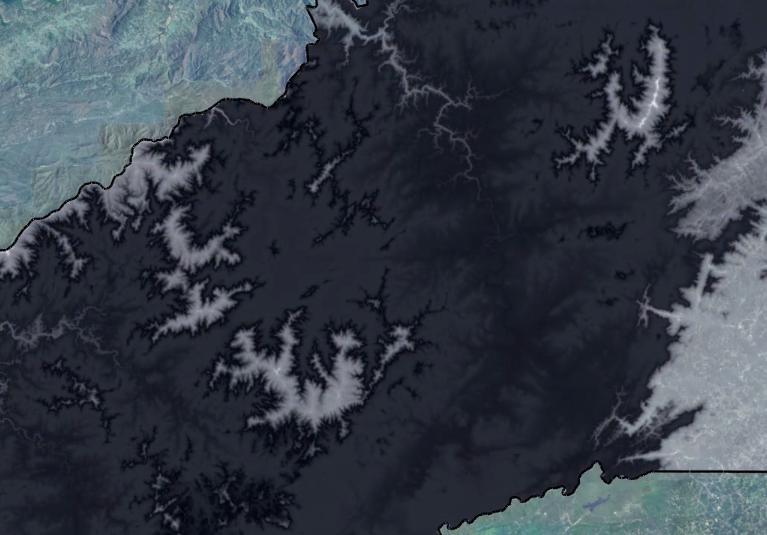
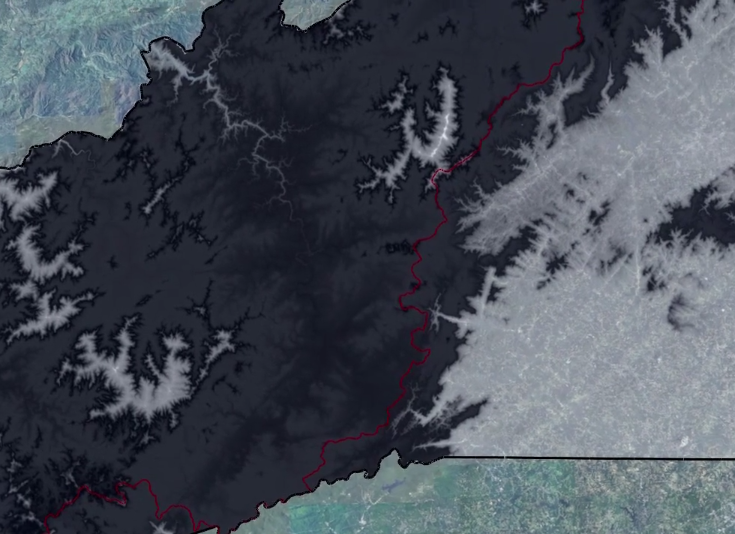
Since these counties are nestled in the heart of the Appalachian mountains, it’s necessary to consider our unique climate and geography when making decisions about the future of our communities.

Uniview cues
04_Elevation (tileset)
Topography map with elevation colored to show differences. Fade from the imagery to show the elevation map.
Scene 7.5, frame 1
Scene 7.5

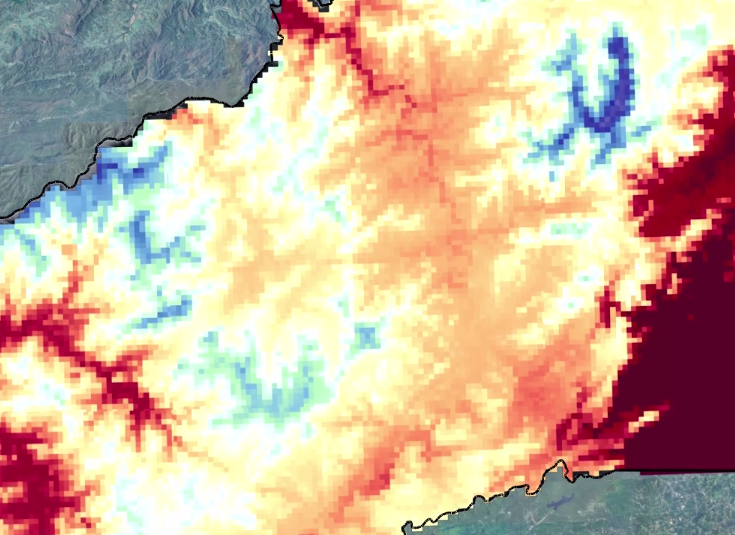
For instance, this average maximum temperature map show how WNC is cooler than the surrounding darker red regions because of its elevation.

Uniview cues
Do a fade from the elevation map to show the Average Max temperature. This shows the importance of elevation.
05_Average_Max_Temp.kmz
Average Max Temp to show that mountain elevations are cooler.
Scene 7.6, frame 1
Scene 7.6

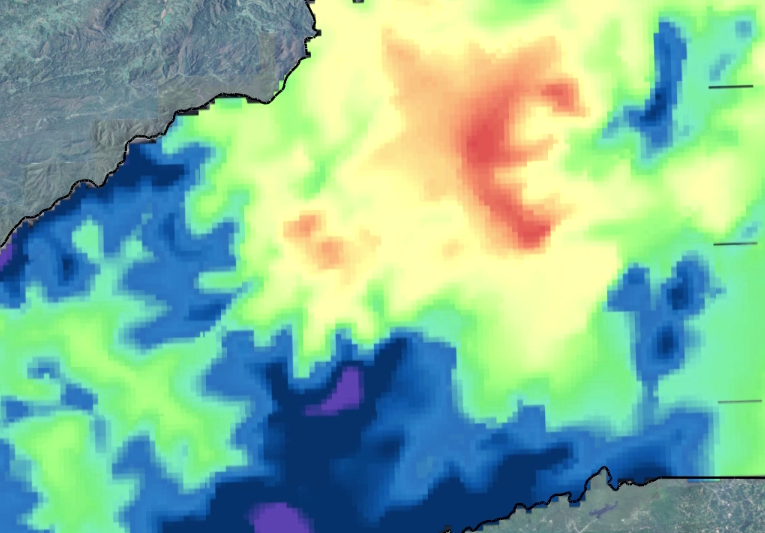
And this average precipitation map shows dramatic variations in rainfall throughout our region that create a number of microclimates .

Because of this, we have the greatest variability in climate in the entire southeast.

Uniview cues
06_AveragePrecip (tileset)
Fade to Average precipitation
Scene 7.7, frame 1Scene 7.7, frame 2
Scene 7.7

The mountain impact on rainfall is also shown by the Eastern Continental Divide.

Rain that falls on the eastern side of the mountains flows into streams that feed into rivers that flow into the Atlantic Ocean.

Rain that falls on the western side of the Divide flows into the Mississippi River, and on into the Gulf of Mexico.

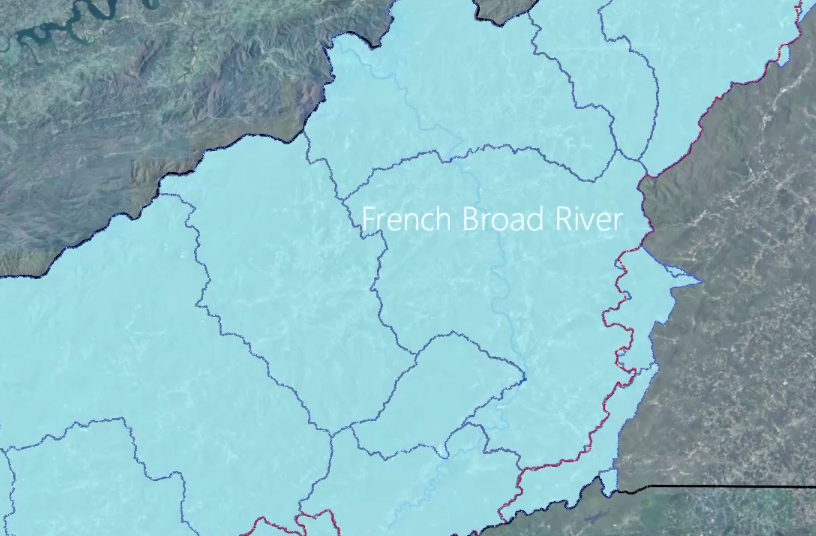
The way that water flows from streams into rivers is a concept called watersheds. Many watersheds are named after the primary river located in the watershed. In this part of Western North Carolina, the main river is the French Broad River. Rainfall that falls in this watershed first flows north, then west, before eventually heading south.

Uniview cues
Move from precipitation to the watersheds. Continental Divide and watersheds
07_Continental_Divide.kml
08_Watersheds.kmz
Scene 7.8, frame 1
Scene 7.8

And this also has an impact on the land cover.

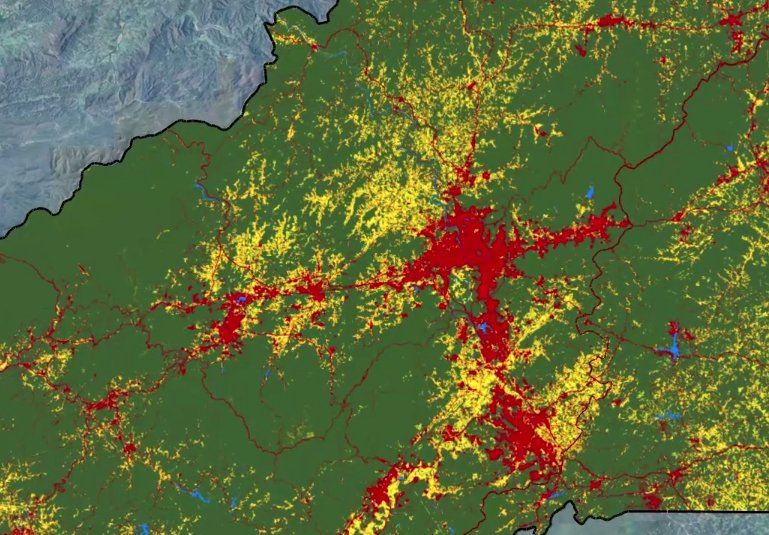
The island of green on this map shows the ”forest” system of WNC. The yellow areas are mainly farmland and the red areas are the human built environments.

Western North Carolina is an island of green in a southeast dominated by major metropolitan areas.

To maintain our quality of life, our challenge is to achieve a healthy balance between these human-built and natural environments.

Uniview cues
We will introduce the Land Cover 2006 map in this discussion and then use it extensively from this point forward.
09_LandCover2006 (tileset)
Scene 7.9

This unique terrain has also impacted the ways in which people have settled in our region.

While native communities lived here for many thousands of years, European settlers found that the natural way into the mountains was by migrating from north to south instead of east to west.

Around the time of the Revolutionary War, the land in Western North Carolina opened to greater settlement, with cheap and plentiful land and abundant natural resources being the draw.

Uniview cues
Turn off Land Cover 2006
Uniview Controls:
Gradually zoom out so we can see the entire eastern seaboard from NC up to Pennsylvania.
Back to imagery, keep NC state line displayed.
Scene 7.10

But these settlements needed iron for their horseshoes and wagon wheels.

This had to be imported from elsewhere until they found iron deposits in Cranberry, NC.

But since there was no coal in the region, they had no way to heat the iron up to smelt it.

So they started clear-cutting entire mountainsides of timber to make charcoal.

But eventually, they ran out of close-by trees and had to bring in energy from elsewhere.

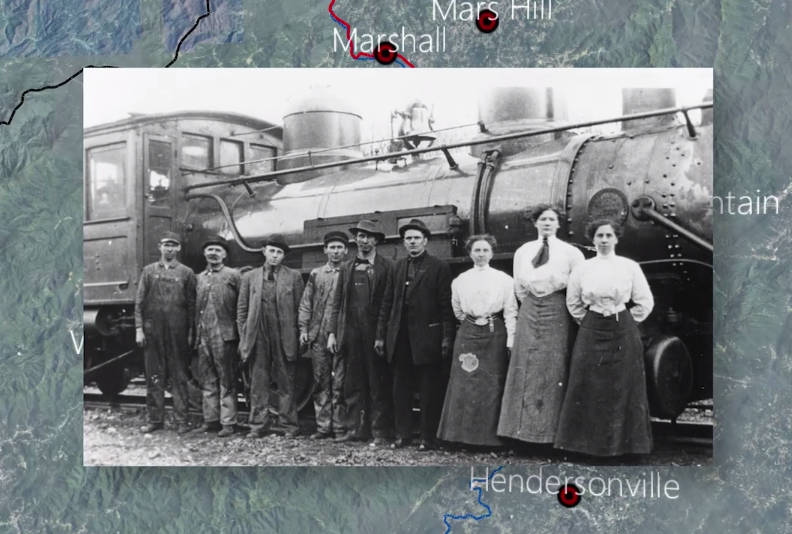
So Tweetsie Railroad was built to transport coal from Virginia and West Virginia to supply the Cranberry forge.

This is a prime examples of how short-term solutions are often not sustainable, and how our decisions must take into account the long-term consequences on the natural environment.

Uniview cues
Staying with the imagery displayed, zoom into Cranberry, located near the NC/TN border close to Banner Elk. Start showing the historical photographs and graphics for the iron forges. Finally show the Tweetsie railroad. 36.131 N; 81.965 W roughly
NCOneMap orthophotos -> Landsat -> Earth
Horseshoe and wagon wheel image
Cranberry: Turn on marker
Clearcutting:
Turn on just Slide 3
Clearcutting:
Turn on Tweetsie image
Scene 7.11, frame 1
Scene 7.11

The locations of settlements and towns have long been dictated by the topography of the mountains.

For instance, the Buncombe Turnpike was established by farmers using the old Indian trail across the mountains that followed the French Broad river to move pigs and turkeys from Tennessee to South Carolina.

But the pigs, turkeys, and farmers could only walk so far in a day.

So entrepreneurs of the time set up inns with livestock pens about every 30 miles along the trail.

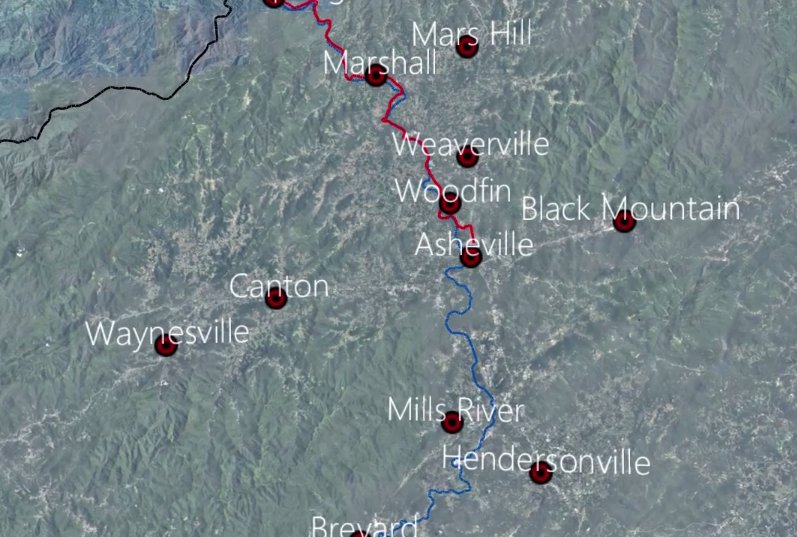
Our current towns of Hot Springs, Marshall, Mars Hill, and Weaverville (to name a few) are located at these old “transportation hubs.”

Uniview cues
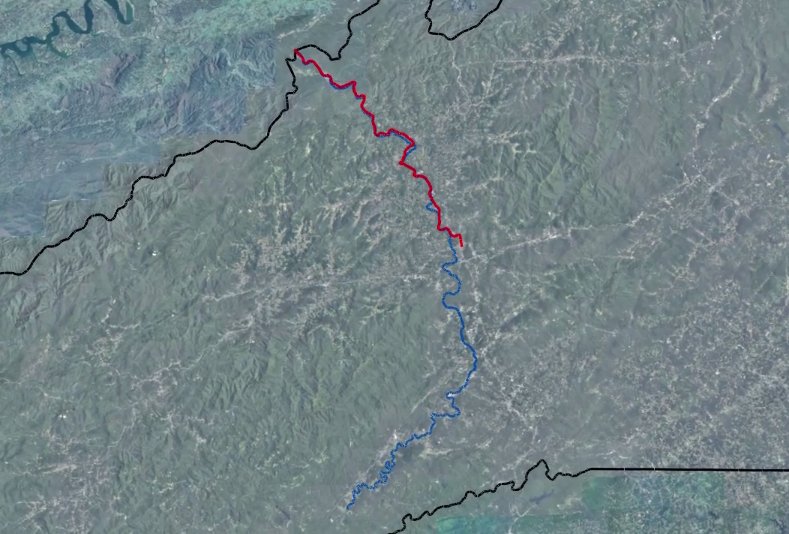
10_French_Broad_River.kml
Show the French Broad River in relation to the mountains and show how it flows to the north.
French Broad River GIS layer shown on top of shaded relief
Turn on a RIVER layer on top of the imagery.
11_Buncombe_Turnpike.kmz
Highlight French broad – Then show the trace of the Turnpike.
It might be nice to get a panorama along NC 251 between Marshall and Asheville to show where the turnpike was and get some nice scenic shots into the dome. This would also show the river, which would lead nicely into the next section.
Finally, show how each settlement was 30 miles apart, start at the TN border and start turning on the “way stations”.
“11_Buncombe_Turnpike_Stops”
Picture of pig, then picture of pigs and drovers. Picture of pigs and turkeys in pack’s square.
Scene 7.12, frame 1Scene 7.12, frame 2Scene 7.12, frame 3
Scene 7.12

When the railroad eventually came to Western North Carolina, it also followed the river. Timber producers used the river as well to transport logs downstream.

But by putting all of this transportation close to a river, they soon encountered unintended consequences.

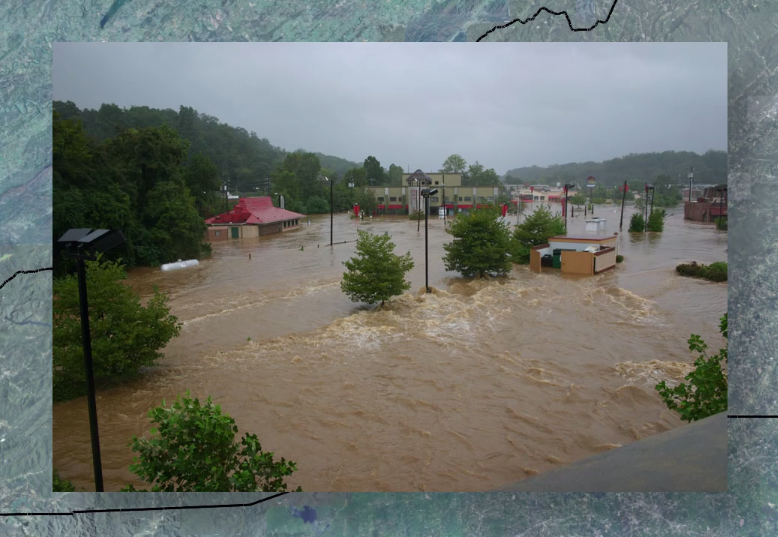
In 1916, two large hurricanes dumped 25 inches of rain into the local watershed.

Tremendous flooding occurred along the Swannanoa and French Broad Rivers, wiping out the local transportation infrastructure and businesses along the river.

Many of these were eventually rebuilt, but not to the same extent as found prior to the flood. Numerous subsequent floods have shown us that we can control our development decisions, but we can’t control Mother Nature.

Uniview cues
Show current river district in Asheville.
Show historical photos we used for the Swannanoa museum
Show photos of the 2004 floods
Scene 7.13

These stories from our history demonstrate the unique challenges facing our region when considering issues of vulnerability and resilience.

So in light of the new realities facing us today, how are we writing our stories for the future?

08

The present: Our five county region

4 scenes
Scene 8.1, frame 1
Scene 8.1

Let’s zoom into the five counties around the Asheville area to see what makes our interconnected natural, tran

sportation, and housing systems work.

Uniview cues
Zoom into the five county region with the ortho photo shown and the five county boundaries.
Scene 8.2, frame 1
Scene 8.2

We live in the middle of a beautiful valley.

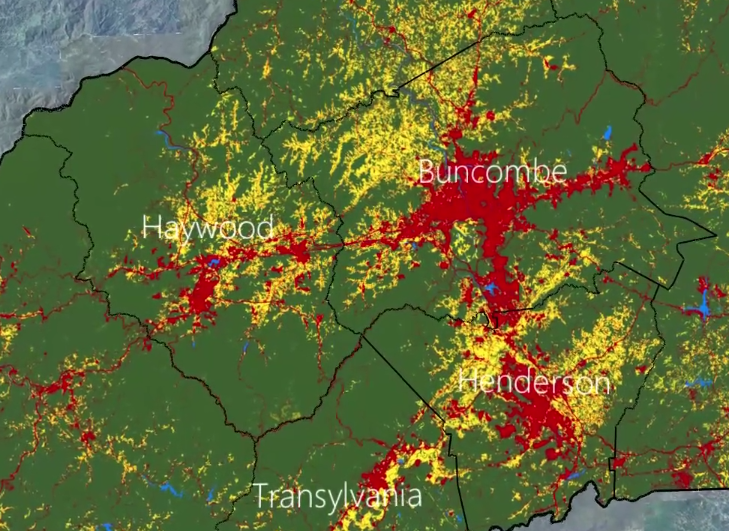
The green areas on this map indicates natural land cover.

Most of the continuous natural areas are located on the steep hillsides and mountaintops.

In contrast, most of the farmland, shown in yellow, and the developed acres, shown in red, are in the valleys, close to the rivers.

Uniview cues
Opportunity of natural beauty, challenge of transportation barrier.
Fade the ortho out and bring up the land cover map. Look at how green the map is.
09_LandCover2006 (tileset)
Scene 8.3, frame 1
Scene 8.3

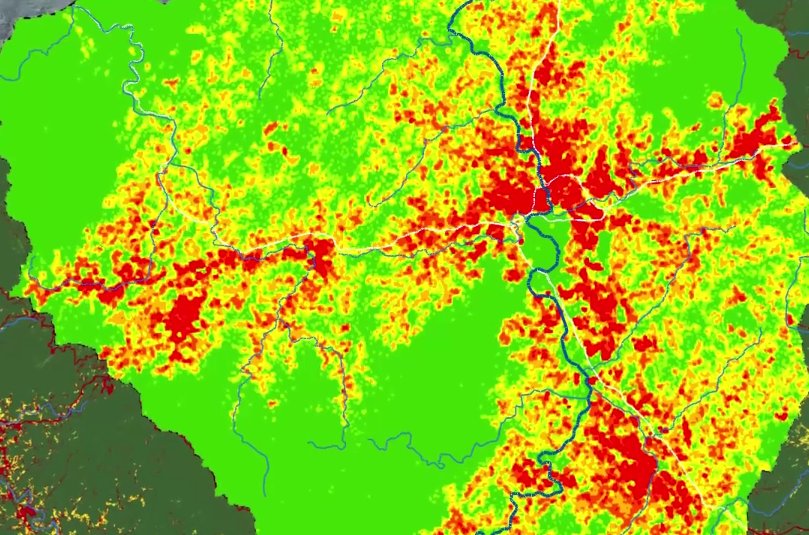
And this parcel density map shows how we’ve built our transportation system along the natural courses of the rivers.

Our houses and businesses started out along the major transportation corridors and branched out from the intersections.

We’re continuing to branch out and up each mountain valley, but we also need to consider how far we should go.

Uniview cues
Steep slopes and hazards:
Parcel Density map, overlain by transportation map.
13_Parcel_Density.kmz
Scene 8.4, frame 1
Scene 8.4

But to do this, it’s important to consider where people work and where they live, and how they get between the two.

Jobs are linked to the Economic System, which is tied to transportation in the Built System, and closely controlled by the Natural System.

So we’re asking how to best make all of these systems more resilient to future changes to keep our communities livable.

Uniview cues
Colored parcel 5-count map
14_Municipal_Boundaries.kmz
15_5-Counties_labels.kmz
09

But we’re learning that we can’t make decisions on a single scale

10 scenes
Scene 9.1, frame 1
Scene 9.1

What might be best for Asheville might not be good for the surrounding rural communities, and vice versa.

We have a shared mountain range, shared watersheds, shared transportation. Our communities are inseparably linked by critical resources and services that go beyond government entities.

We need to look at our five counties as a single system in order to make some of the tough choices that we’re facing.

Choices affecting our future need to be made at a variety of scales in order to move from vulnerability to resilience.

Uniview cues
16_Towns_points_labels.kmz
Now show the five counties with the background imagery and shaded relief, and then turn on the land cover map with shaded relief. Make sure the county boundaries are shown and the communities are labelled.
Scene 9.2

So let’s look at some of the interconnections between our communities to consider how our past might inform our future.

Uniview cues
Move (don’t zoom) to show Henderson County and the role it plays as a gateway community for Greenville and Charlotte.
Scene 9.3, frame 1
Scene 9.3

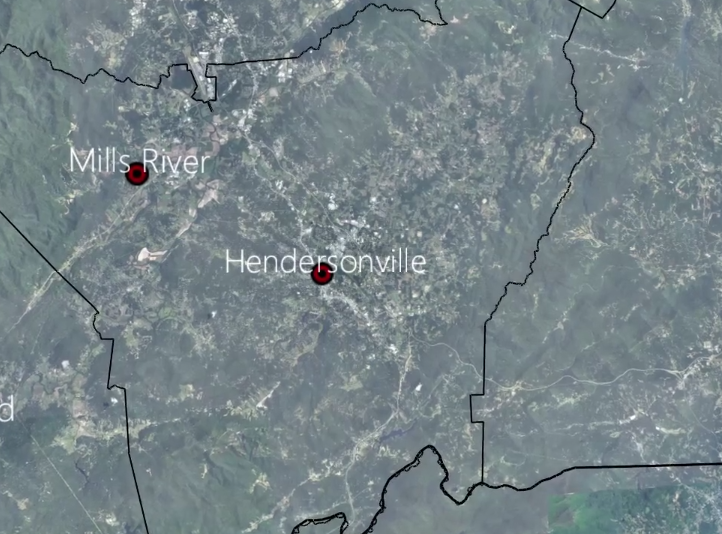
Henderson County has a long history of being the gateway to the rest of the valley, and initially many of its homes and towns were built as places for people to come and escape the summer heat of the coastal states.

It also has been an agricultural center due to its rich soil, fairly flat land, and heavy precipitation.

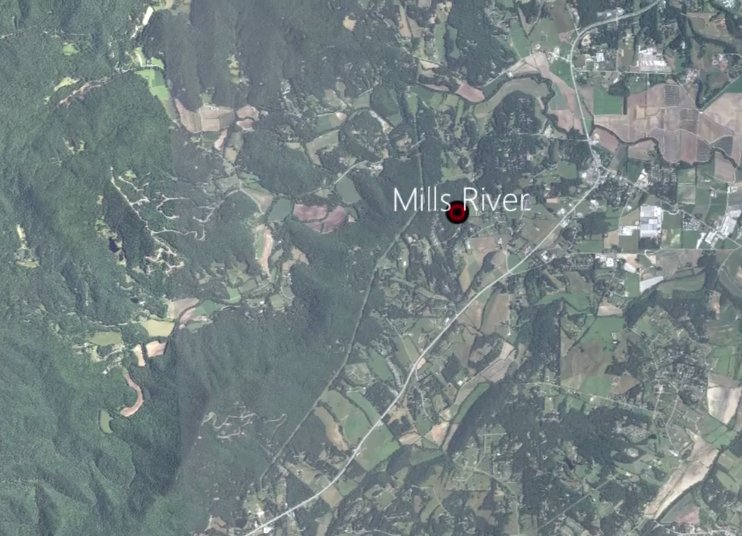
But the fact is that it’s a gateway community is starting to put tremendous pressure on its cultural heritage, including apple farming and other farms in Mills River.

We see the same thing continuing today, as many people buy second homes in the Hendersonville area.

So the challenge is finding the right balance between new development and preserving agricultural land.

Uniview cues
Fade or toggle back to the imagery.
Pan to Mills River
Scene 9.4, frame 1
Scene 9.4

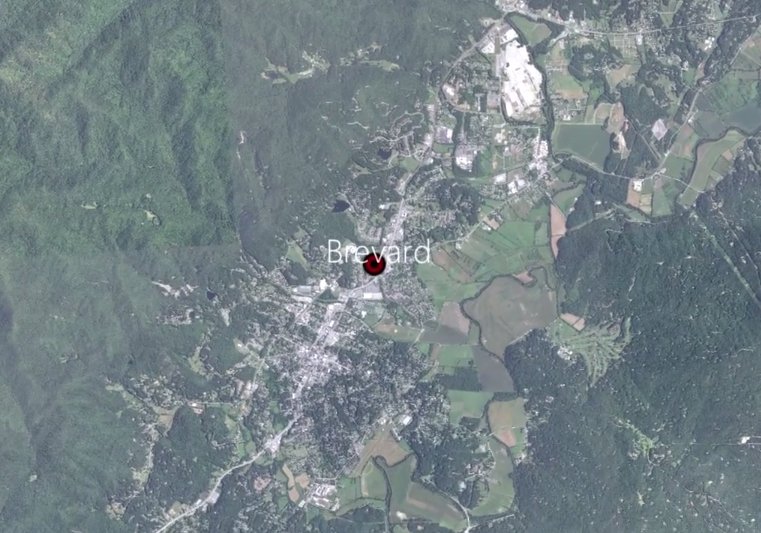
As we move to the southwest along the Brevard Fault Zone into Transylvania County, we see how the natural topography of the mountain controls the transportation corridor.

Transylvania County has the greatest average annual precipitation in the five-county area, and also the greatest percentage of conserved lands.

Brevard is the largest population center in Transylvania County and serves as a major tourist and cultural destination.

Uniview cues
Pan down to the SW to center on Brevard.
Scene 9.5

As we move from Transylvania County north into Haywood County, we cross a major set of mountains, including Mount Pisgah and Cold Mountain.

We cross the Blue Ridge Parkway and drop into a collection of small valleys and communities.

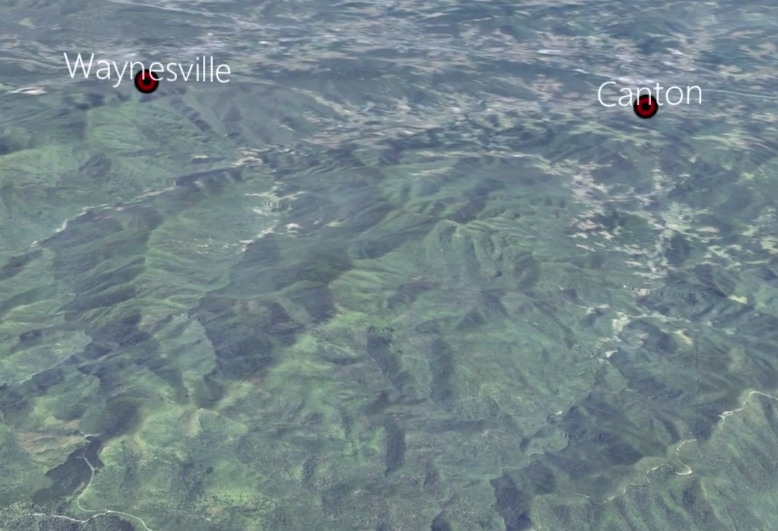
The communities here are much smaller, and fewer people live here. Each small valley or cove has its own ownership and character, but they are linked to the major towns of Waynesville and Canton located downstream.

Uniview cues
Pan over to the Sandy Mush area and toggle between ortho and land cover.
Scene 9.6, frame 1
Scene 9.6

Of course, major employers have a significant impact on communities and their decision making.

The paper mill in Canton is located at an important linkage between the river, the I-40 corridor, downtown Canton, and the small farm communities that surround Canton.

Uniview cues
Pan to the Waynesville and Canton corridor.
Scene 9.7, frame 1
Scene 9.7

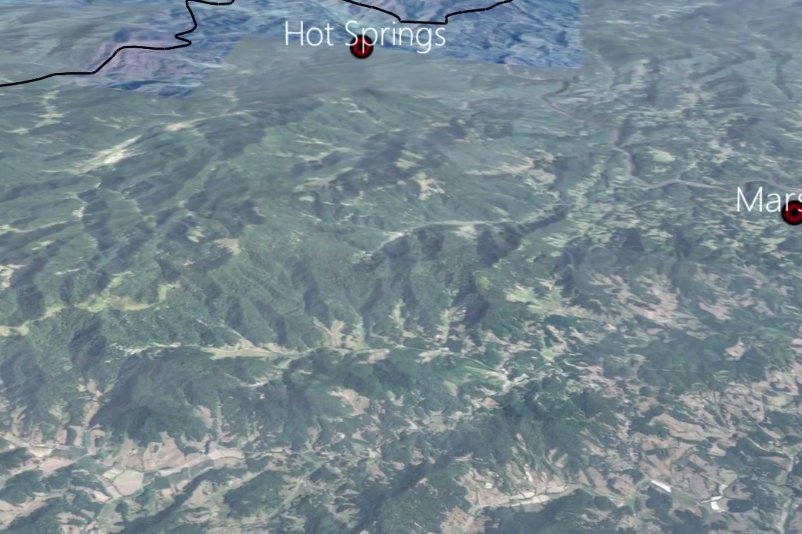
Moving north, out of Haywood and into Madison County, we can see how small towns have evolved but sometimes haven’t changed much.

Both Marshall and Hot Springs were main stops along the Buncombe Turnpike.

Will these communities retain their present character, or will the new realities or higher energy prices and climate variability have a greater impact on them?

Uniview cues
Pan to Hot Springs
Scene 9.8, frame 1
Scene 9.8

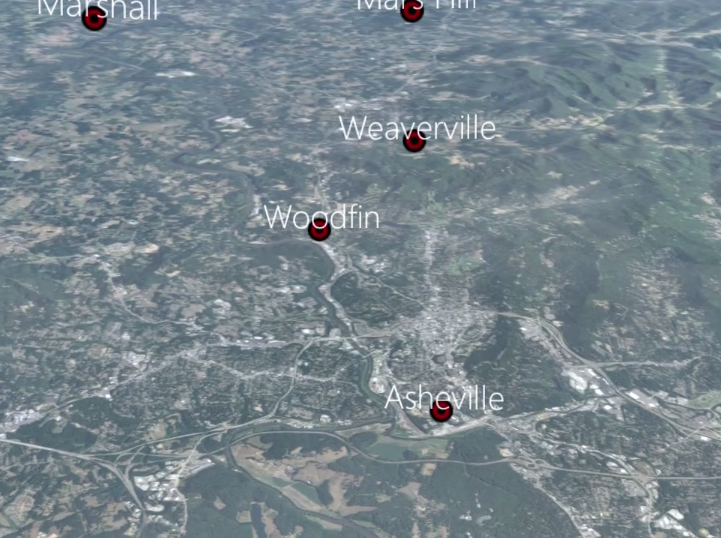
Moving south along I-26, we pass over Weaverville and Woodfin into North Asheville.

The city of Asheville is a collection of neighborhoods, each with its own character and sets of driving forces.

For instance, West Asheville is a community with a clear community center located along Haywood Road, which has led to a higher population density than many of the surrounding rural communities.

Uniview cues
Uniview controls:
Pan to Asheville
Scene 9.9

Moving further south, we see that Arden is outside of the Asheville city limits.

Though it doesn’t have its own community center, but is located very close to the main growth areas for the five-county area.

It remains to be seen how rising costs of energy and other factors will affect this type of suburb community.

Uniview cues
Uniview controls:
Show Arden relationship to South Asheville
Scene 9.10

So as we look at our current choices, it’s important to consider where we’ll live and work in the future.

Will we choose denser settlement close to the main transportation and employment centers, or will we continue to convert the natural land and move further up into the mountains?

Uniview cues
Mark areas of steep slope, flood plain, agricultural lands, conserved lands
10

We can also look to the past to inform our future

5 scenes
Scene 10.1, frame 1
Scene 10.1

We can also look to the past to inform our future.

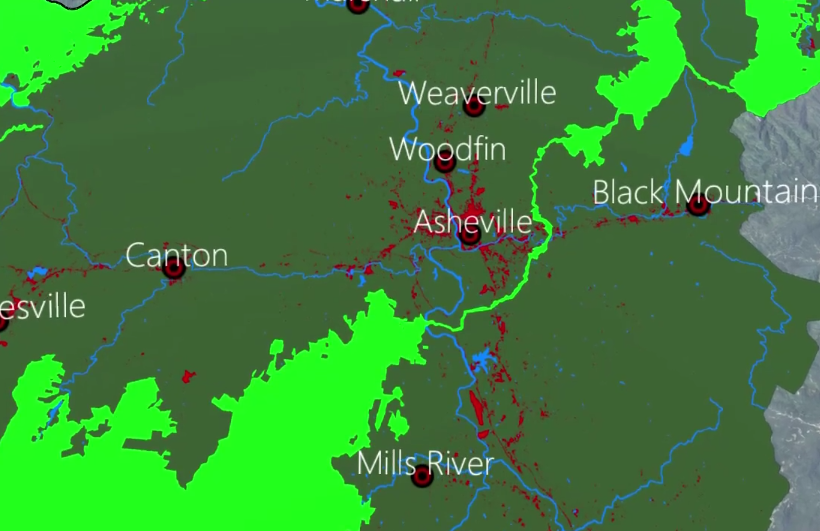
If we look at this map of land use in 1976, we see how developed areas in red followed the fertile, accessible, low-lying land with a concentration in the river valley.

The light green areas were conserved lands at the time.

Uniview cues
17_LandUse1976 (tileset)
Scene 10.2, frame 1
Scene 10.2

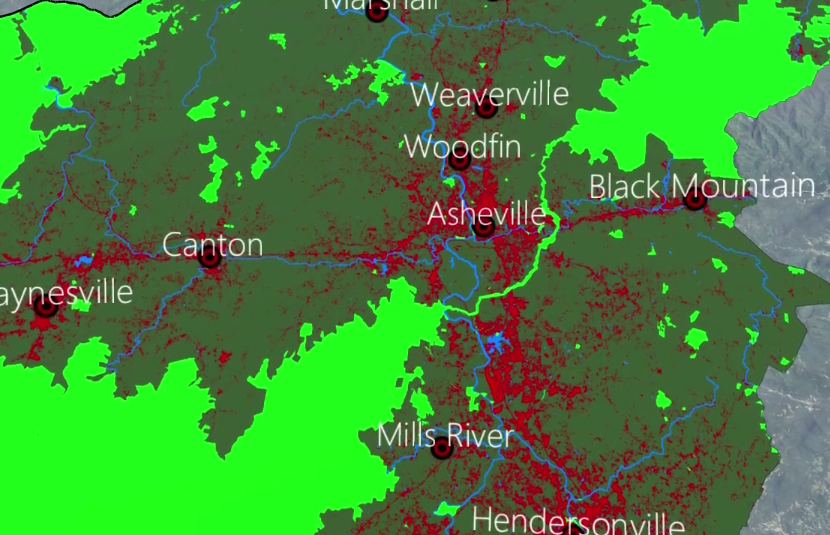
This map of land use in 2006 shows that much of the flat land in the river valleys has now been “settled,” and we’re starting to use land that was never before considered habitable.

And development continues to concentrate on this valuable land.

Cheap energy has encouraged us to live further and further away from the community centers of the past.

But at the same time, this map also shows how in recent decades, significant amounts of land have been put into conservation.

The issue facing us now is finding ways to maintain our land and quality of life while providing housing and good jobs for the increasing number of people that want to live here.

Uniview cues
18_LandUse2006 (tileset)
Scene 10.3, frame 1
Scene 10.3

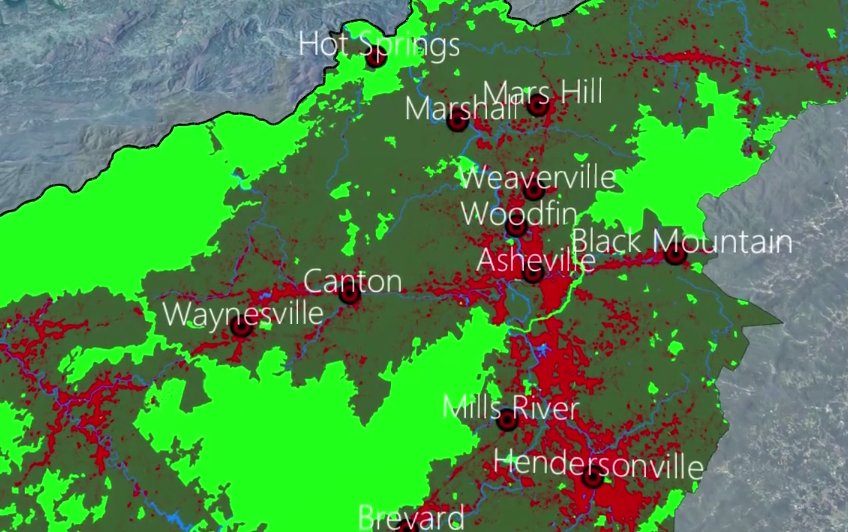
And this map of projected land use in 2030 shows how build-out is expected to continue if we keep following current trends.

This will put more pressure on less accessible, less habitable spaces.

Which is why we need to be considering how to make more balanced choices.

Uniview cues
Land Use 2030
19_LandUse2030 (tileset)
Scene 10.4

People in our region value land, and have building relationship with it for generations to not only preserve their way of life and cherished natural resources, but also to ensure the health and beauty of the natural environment.

Scene 10.5, frame 1
Scene 10.5

Because when it comes to making our communities more resilient, outside forces impact local decisions. When we consider our decisions from this whole systems perspective, it becomes apparent that no man, or community, is an island.