Storyboard · WvN07

The Lake Effect: Creating a Resilient Future

Explore the past, present, and future of humanity’s relationship with the Great Lakes watershed, one of the largest fresh water systems on Earth.

Premiered
October 2012
Venue
University of Michigan Museum of Natural History (formerly the Exhibit Museum)
Scenes
28

Web version · Original script and storyboard (Google Doc) »

01

Introduction to the BCD

1 scene
Scene 1.0, frame 1
Scene 1.0

The Great Lakes. Source of 22% of the Earth’s surface fresh water. A resource whose value is often not fully recognized. The purpose of this discussion is to make clear how precious and endangered the Great Lakes and their watershed have become. Further, it is important to understand that, while in considerable trouble and facing unprecedented change, we can restore the Lakes for our own and future generations. To really grasp these concepts, it is necessary to take a step back and consider where the Lakes came from in the first place, as well as how we got to the state we are currently in.

Humans. We are integral to the ecosystems we inhabit. Our actions can have both positive and negative repercussions on the entire water shed system, which in turn affects our health. We've learned that there really is no separation between social and ecological systems. What humans do to the ecosystem has repercussions on the system, and the same is true in the opposite direction. We can no longer pretend that we can do what we want and not impact the environment, nor that this impact will come back on us. We are seeing it time and again.

Uniview cues
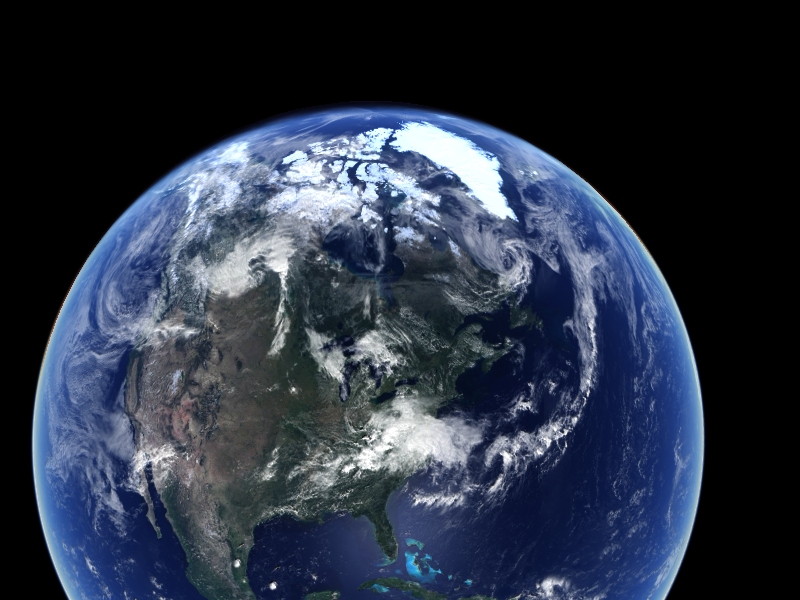
Opening shot of Blue
Marble
02

Global: Introduction to Main Story

15 scenes
Scene 2.0.1, frame 1Scene 2.0.1, frame 2
Scene 2.0.1

The source of this water, like virtually all water on Earth has its origins back in time and deep in space. Water is found in the swirling clouds of dust and gas deep in space. It is found where we believe young planetary systems are forming. Nearly five billions years ago, as our young solar system formed, Earth was pounded by comets and asteroids that brought much of our water to Earth.

That water has driven and supported the evolution of many forms of life on our planet over time, and sustains the life cradled by the Earth today. Without water we could not survive. It is because of water that life—plants, animals, us, exist here today. Humans, and almost every living creature on Earth use, water as a means of transportation, food, and basic biological functioning. Our bodies are composed of up to 75% water.

Sources

For a review, see T. Encrenaz, 2008, “Water in the Solar System,” Annual Review of Astronomy and Astrophysics, 46, pp. 57–87.

For asteroids contributing to Earth’s water, see Alexander, C. M. O'D., Bowden, R., Fogel, M. L., Howard, K. T., Herd, C. D. K., and Nittler, L. R., 2012, “The Provenances of Asteroids, and Their Contributions to the Volatile Inventories of the Terrestrial Planets,” Science, 337(6095), pp. 721-723. For cometary origins of Earth’s water, see Hartogh, P. et al., 2011, “Ocean-like water in the Jupiter-family comet 103P/Hartley 2,” Nature, 478, pp. 218–220.

Link to Young Star

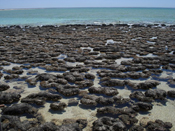
Like to Stromatolites

Scene 2.0.2, frame 1
Scene 2.0.2

Approximately 70% of our planet is covered in water with the oceans holding about 96% of it. However, our planet also has water in the atmosphere as well as in rivers, lakes, glaciers, and within the soil and aquifers underground, and within each living creature on the planet. Water is found in many forms and in so many places, but most of this is not accessible nor in a form that fosters or supports life. Let’s look at how some of that water is distributed.

Sources

From the USGS Water Science School webpage, How much water is there on, in, and above the Earth? with data derived from Igor Shiklomanov, 1993, “World Fresh Water Resources,” in Water in Crisis: A Guide to the World’s Fresh water Resources, Ed. Peter H. Gleick, New York: Oxford University Press.

Water sphere visualizations created by Ka Chun Yu.

Cryosphere

Global Rivers: can be created from http://www.naturalearthdata.com/downloads/10m-physical-vectors/

North America.

How much water is there on, in, and above the Earth?

http://www.naturalearthdata.com/downloads/10m-physical-vectors/

North America

Scene 2.1.1, frame 1
Scene 2.1.1

Continental: Introduction to Freshwater

Of all the sources of fresh water on the planet, the largest are those found in aquifers beneath our feet. These massive sources of water, along with snow melt, rain, and so forth, feed the rivers, lakes, and streams and keep the soil moist and alive. Of the sources most available to humans though, the largest is held in the planet’s freshwater lakes.

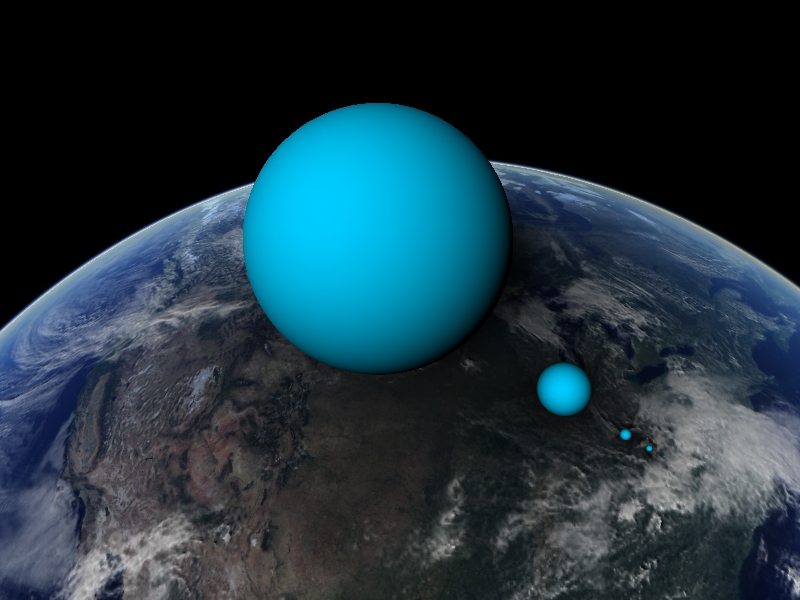
Among these lakes the Great Lakes harbor three of the largest fresh bodies of water on the planet. And yet, for all the appearance of vast and unending amounts of water, the actual renewable nature of the water in the Lakes is limited to one percent of the total. If we look again at the spheres representing the amount of water in the Great Lakes, and add a sphere to represent renewable water, we see that it represents only a fraction of the total amount. We must reconsider our estimates of how much use the Great Lakes can support.

Sources

US Aquifers from USGS

Lake boundaries via Global Lake Ecological Observatory Network

http://lakebase.gleon.org/

(shp); National Atlas Aquifers

Aquifers of Alluvial and Glacial Origin from USGS: shapefiles from National Atlas and description here.

Aquifers KML

National Atlas

here

Great Lakes Basins KML

http://lakebase.gleon.org/

National Atlas Aquifers

Scene 2.2.1, frame 1Scene 2.2.1, frame 2
Scene 2.2.1

Continental: Origins of Network of Great Lakes

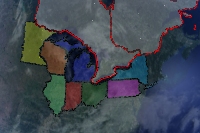
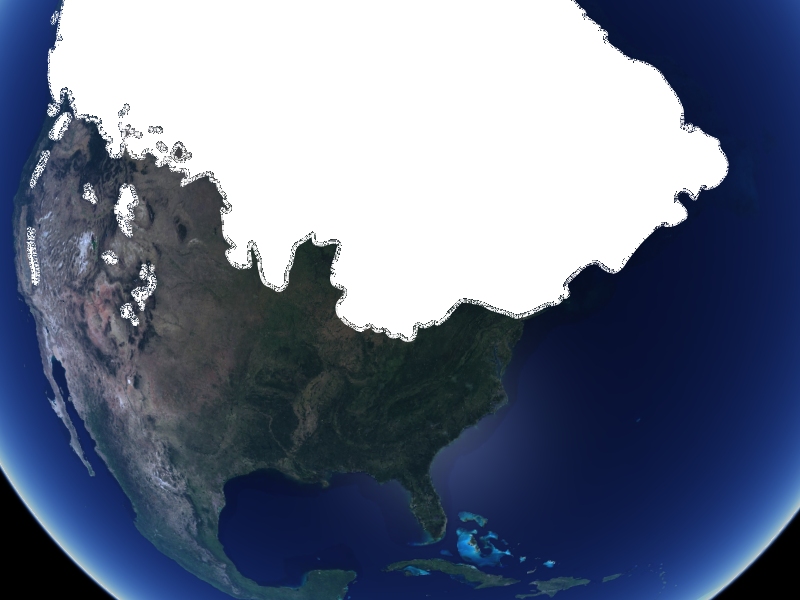
Anyone who lives in the lower peninsula of Michigan knows that they have a ready made, “I live here” map of their home state. This shape is unique, due to the way continental ice sheets repeatedly moved across the region during the last ice age, gouging out the lakes and giving them and the state their distinctive shape. Today, the Lakes and their watershed touch on seven states and two provinces of Canada.

Some of Michigan’s native people have a more modern view of what can now see from space -- the mitten shape of the lower peninsula. Upon making the land we call the lower peninsula, the Great Mystery wanted to see what had been made and admire it. But the Earth was spinning and difficult to see. So the Great Mystery reached out with the left hand and pressed it onto the Earth to stop the spinning. The mark left behind is what we today call Michigan. And so, we were left with a ready-made map that we could use to tell strangers about where we live.

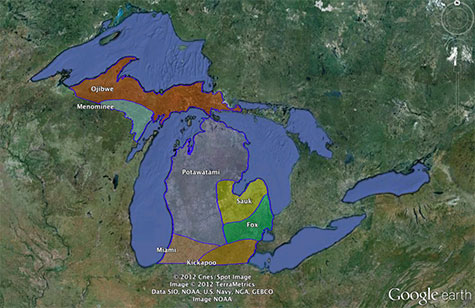
Many groups of Native peoples live in and around Michigan today, viable remnants of the truly “First People,” to live in Michigan.

Sources

State boundaries via Natural Earth http://www.naturalearthdata.com/downloads/10m-cultural-vectors/ (shp)

Native Tribal map:

http://www.native-languages.org/michigan.htm

50 US States KMZ

Great Lakes States KML

Great Lakes Provinces KML

Native Tribes KMZ

http://www.naturalearthdata.com/downloads/10m-cultural-vectors/

michigan.htm

Scene 2.2.2, frame 1
Scene 2.2.2

About three million years ago the last major ice age gripped the Earth resulting in massive amounts of ice to shape the landscape of Michigan, and North America in general.

Ending in the late Wisconsinian period of the Pleistocene Epoch glaciers had repeatedly moved across the Great Lakes Basin scouring out the Lakes, and depressing the Earth’s crust beneath them. Beginning when the ice last left the region, and continuing today, the Earth’s crust began to rebound from the weight of the absent ice.

As the ice retreated, a new series of post-glacial lakes emerged and existed for a time. Then they were changed through re-advances of ice, more retreats, and the opening of an ever-changing series of new outflow channels. Prior to this moment, the Lakes were more or less isolated from the rest of the world. Whatever ecosystems evolved in them while they lasted, were unique. This was about to change.

Sources

Glacial Extent Over Last 20,000 years:

Shapefiles from James Clark (see

http://www.esri.com/news/arcuser/0609/shorelines.html):

http://files.worldviews.net/WvN07_Exhibits/GL_Ice_Shapefiles.zip

Show glacial extent for 3-4 different times from last 20,000 years including present day?

shorelines.html

GL_Ice_Shapefiles.zip

Scene 3.1.1

Bioregional: Native Settlers

Though possibly earlier, by 8000 BC there were likely people using the Great Lakes as they then existed. Some authors suggest that people could have arrived by about 14,000 years ago. These people left little behind and were most likely hunter-gatherers following herds of animals but likely also planted crops and used area plants once they settled somewhere.

Early indigenous people often placed their settlements along the waters, from the streams and rivers to the Great Lakes shorelines. Human intervention of the Lakes and their watershed had begun.

Scene 3.1.2, frame 1
Scene 3.1.2

These early settlers brought new seeds for crops from elsewhere on the continent, from things they liked and use, to items acquired through trade. It is reasonable to assume that plant seeds would have been included. Not to be considered “invasive,” these food crops were nonetheless “new” to the Great lakes region.

Scene 3.1.3, frame 1
Scene 3.1.3

They also likely used fire to clear land for agriculture, just as do many tropical-forest root-crop farmers today. Human intervention in the shaping of the ecosystems was underway.

Scene 3.2.1, frame 1
Scene 3.2.1

Bioregional: European Settlers

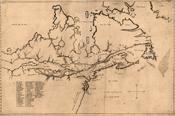
While the indigenous communities shaped the ecosystems for thousands of years through agricultural and hunting practices, it was the arrival of the European settlers in the 17th century that began dramatically changing these environments. French, British, and American settlers gradually introduced an increasing amount of pollution and over use, as well as considerably more invasive species.

Sources

http://www.greatlakesmaps.org/Default.aspx?tabid=83&MapID=2

Image of Champlain Map

1619 map

Default.aspx

Scene 3.2.2, frame 1Scene 3.2.2, frame 2
Scene 3.2.2

Arrival of the Europeans resulted in the next leap in the degradation of the Lakes.

During the 18th and 19th centuries the river and lakes were used as garbage cans in which all sorts of material was dumped. The belief was the water would dilute whatever substance was put into it and neutralize the problem. The means for invasive species introduction became more vast with shipping routes and canals, specially.

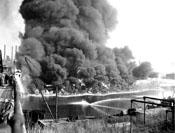
The overuse, degrading and polluting of the Great Lakes continued. It reached a low in the period from 1868 to 1969. During this time, at least 13 river fires were reported. Shown here is the 1969 Cuyahoga river, fire near Cleveland, Ohio. Although not the first time this had happened it caught the attention of the nation.

Scene 4.1.0, frame 1Scene 4.1.0, frame 2
Scene 4.1.0

Bioregional: Invasive Species and Biodiversity Loss

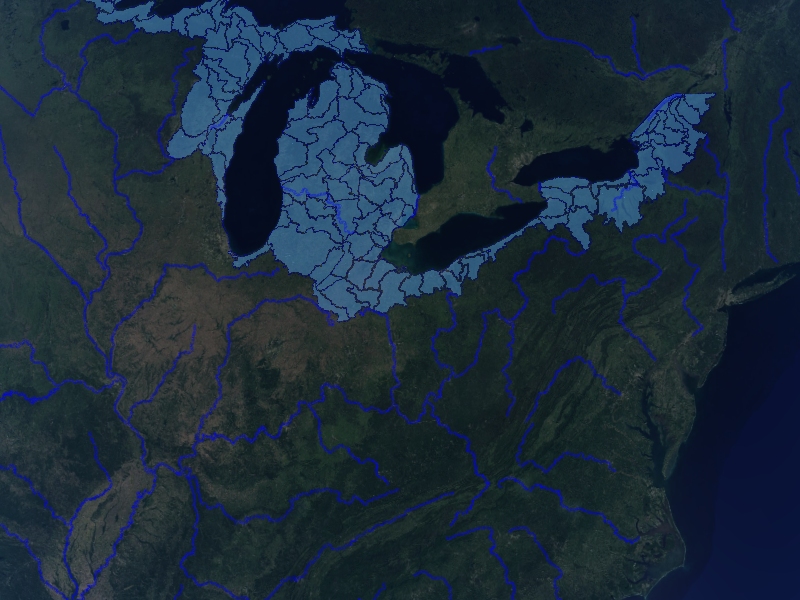
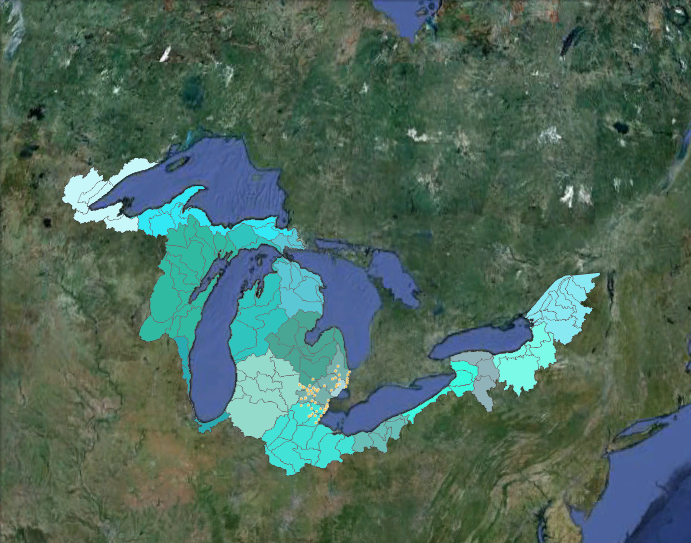
Today’s Great Lakes watershed encompasses nearly 300,000 square miles and includes five states along with the Province of Ontario, Canada. This watershed feeds into the Lakes like arteries that then flow out into the Atlantic Ocean, further connecting the Great Lakes to the Earth’s water system as a whole.

Sources

Watershed data from National Hydrographic data: http://nhd.usgs.gov/data.html

KMZ

KMZ

Great Lakes Watershed KML

data.html

Scene 4.1.1

Biological and chemical pollution has proven to be a considerable threat to the lives of people and native species in the watershed. Plants, animals, and aquatic invasive species play a large role in changing the ecosystem as a whole.

Approximately 180 invasive species have been identified in the Lakes alone. Of the total 3500 species that live in the lakes many of these are facing low populations due to human and biological pollution issues.

Many means of introducing pollution exist such as inter-basin flooding, ships’ ballast water discharge, human recreation, and migration of invasive species. Some of these are natural while others are brought on by human negligence to take care in their activities.

The 1825 opening of the Erie Canal proved to be the single most significant event, foreshadowing the vast transfer of ballast water between basins, oceans, and continents.

Sources

http://www.mcgi.state.mi.us/mgdl/?action=thm

Geographic Data Library GIS..check for invasive species.

- channels, shipping data (historical? or present - day?).

Huron- Erie canal:

http://huron-erie.org/mapresources.html Link to many historic map data providers.

http://www.mcgi.state.mi.us/mgdl/?action=thm

mapresources.html

Link

Scene 4.1.2

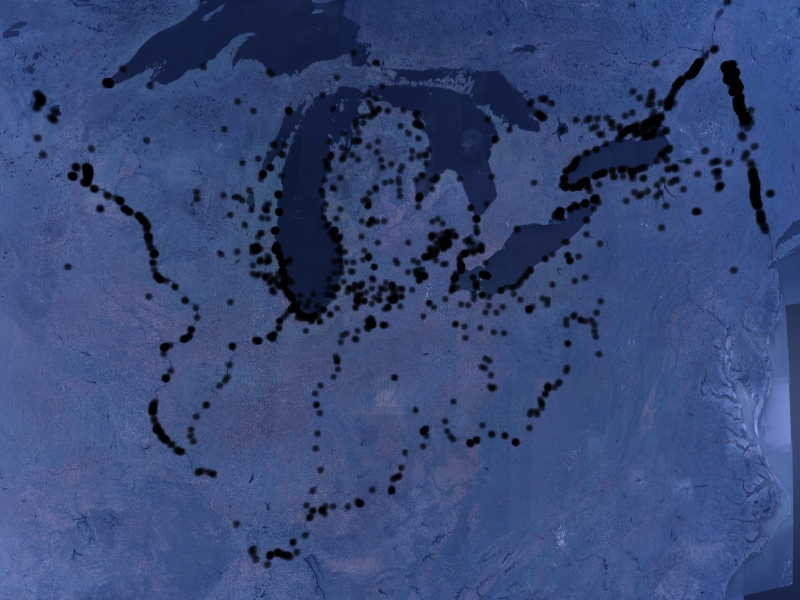
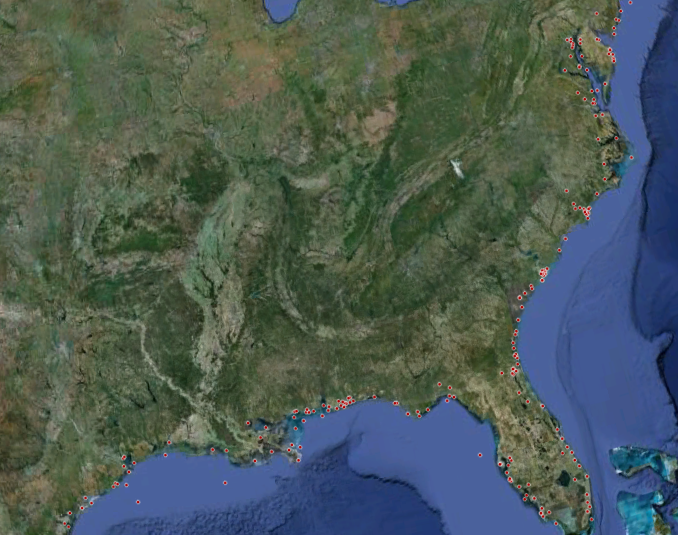
The first truly “dangerous” aquatic invader into the region was the Sea Lamprey. Later came the Zebra mussels with their ability to quickly reproduce. And the Asian Carp has been the most recent invader to have an impact on ecosystems within the basin. These creatures have proven to be both hostile to the health of other aquatic life and with the lives of humans nearby.

Sources

Nonindigenous Aquatic Species

Uniview WMS Service

http://gis.glin.net/geoserver/wms?request=GetCapabilities&service=WMS

Sea Lampreys KMZ/SHP: http://gis.glin.net/ogc/services.php#lm_sealamp_locs_mfa

Point distribution map: http://nas2.er.usgs.gov/viewer/omap.aspx?SpeciesID=836

Asian Carp point distribution maps:

Grass carp - http://nas2.er.usgs.gov/viewer/omap.aspx?SpeciesID=514

Black carp - http://nas2.er.usgs.gov/viewer/omap.aspx?SpeciesID=573

Silver carp - http://nas2.er.usgs.gov/viewer/omap.aspx?SpeciesID=549

Bighead carp - http://nas2.er.usgs.gov/viewer/omap.aspx?SpeciesID=551

SpeciesList.aspx

Nonindigenous Aquatic

services.php#lm_sealamp_locs_mfa

omap.aspx

omap.aspx

omap.aspx

omap.aspx

omap.aspx

Scene 4.2.1, frame 1
Scene 4.2.1

Sea Lamprey:

Bioregional: Biodiversity Loss Examples

These creatures are parasitic and feed upon the blood of other fish by attaching themselves via their suction-cup like mouth that grasps on to the flesh of fish.

These creatures play an important role in loss of biodiversity as they feed a large amount on lake trout which, as an apex species, are needed to control the ecosystem as a whole. As numbers of these apex species dwindles the tipping point in which the environment and ecosystem will be forced to change drastically is nearing.

Sources

Sea lamprey in Fish Atlas with years via MI gov (shp) http://www.mcgi.state.mi.us/mgdl/?rel=thext&action=thmname&cid=8&cat=Fish+Atlas

Show point distributions of invasive species. Play with color coding, size and type of points.

Need to find data source for Asian carp species.

http://www.mcgi.state.mi.us/mgdl/?rel=thext&action=thmname&cid=8&cat=Fish+Atlas

Scene 4.2.2, frame 1
Scene 4.2.2

Zebra Mussels:

These creatures, native to Russia, have proven to be a larger problem for humans than the ecosystem as a whole. The mussels are quickly reproducing and cling on to all sorts of objects, including intake pipes that draw water into treatment plants and electrical generation plants. It is estimated that the costs of efforts to control these invaders exceeds $500 million a year in repairs and prevention to technology in the the Great Lakes alone.

Sources

Zebra Mussel Distribution KML from GLIN.NET zebra mussel distribution

Show point distributions of invasive species. Play with color coding, size and type of points.

KML

zebra mussel distribution

05

Bioregional: Impacts of Pollution

3 scenes
Scene 5.1, frame 1Scene 5.1, frame 2
Scene 5.1

Humans often choose not to clean up after themselves. They often ignore what they dispose of without giving thought to what will become of their trash, or what impact it will have. As previously mentioned, in the 18th and 19th century it was believed that water could dilute any substance, and almost any quantity has lead to unexpected pollution in the Great Lakes and in watersheds around the globe.

And our actions are not only affectting us, but people and communities downstream as well.

Scene 5.2, frame 1
Scene 5.2

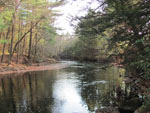
Smaller watersheds feed into larger ones that then join the Great Lakes themselves. These nested watersheds naturally provide sources of both water and contamination. This makes it easy for point source pollutants to drain directly into the water. With such a wide spread area these nested watersheds naturally provide sources of both water and contamination. Many types of point source pollutants drain directly into the water and play an active role in the overall pollution of the watershed.

Pollutants that enter the watershed far from the Lakes will eventually make their way into the Lakes -- such is the nature of an interrelated system. People who live “down-system” might feel the impact of an incident far, far away.

Sources

Watersheds

http://www.nationalatlas.gov/atlasftp.html#hucs00m (shp)

HUC6 and HUC8 watershed data from USGS National Hydrography Data http://nhd.usgs.gov/data.html

WvN07_Exhibits.Scene5.2.HUC8Watersheds.v2.kmz

atlasftp.html#hucs00m

data.html

Scene 5.3, frame 1Scene 5.3, frame 2Scene 5.3, frame 3
Scene 5.3

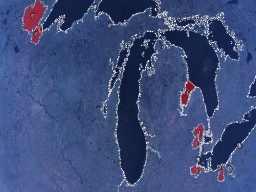
The EPA says that there are no fewer than 32 (2011) areas of concern on the US side of the Great Lakes alone. These area, predictably, are in the most populated and industrialize areas of the Lakes. As of June, 2011, there were 84 “Long Term Cleanup Sites” listed by the EPA in Michigan. Most of which are on or near bodies of water.

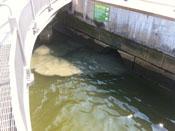
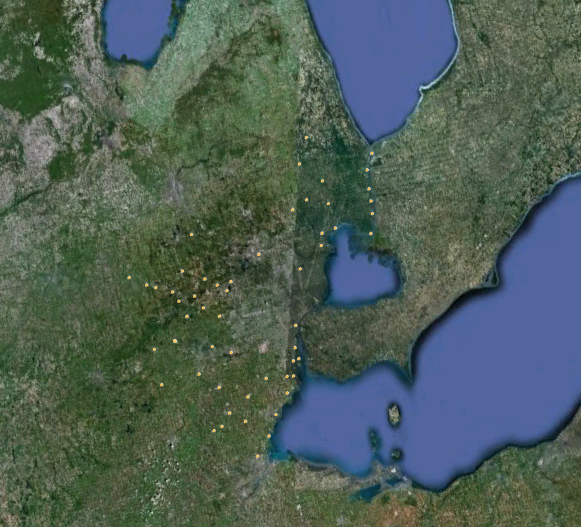
Sewage Plants are a prime example of point source pollutants. In 2009, Detroit’s sewage plant alone reported overflows that sent 32 billion gallons of combined untreated and partially treated sewage with storm runoff into the Detroit and Rogue Rivers, and on to the Great Lakes.

Runoff takes chemical toxins from households, car washes, animal and human waste, oil from cars, and buildup of other chemicals and materials on pavement and rushes it straight into the waterways. NO DATA

Runoff also occurs when over-watering of agricultural areas occurs. This causes a massive amount of damage that sends pesticides and other chemicals from the fields into the waterways. These pollutants move downstream and, as we see in the Gulf of Mexico, can cause dead zones in which algae blooms are so high that it depletes the water of oxygen and kills fish and wildlife--leaving a place barren of life. (non-point, can be mentioned).

Sources

EPA Enviromapper- superfund sites, etc.(kml,shp): http://www.epa.gov/emefdata/em4ef.html?ve=6,44.87474822998047,-85.7309799194336&pText=Michigan

Global eutrophic sites via WRI http://www.wri.org/project/eutrophication/map (xls with lat/long)

Municipal Wastewater Treatment Facilities, Southeast Michigan Council of Governments http://www.semcog.org/MapCatalog_EnvironmentAndLandUse.aspx

*Link to collaborator Lansing

gl_aoc_boundaries.kml

WvN07_Exhibits.Scene5.3.EutrophicAreas.kmz

WvN07_Exhibits.Scene5.3.DetroitWastewaterFacilities.v3.kmz

em4ef.html

http://www.wri.org/project/eutrophication/map

MapCatalog_EnvironmentAndLandUse.aspx

06

Challenges for the Coming Century

5 scenes
Scene 6.1, frame 1
Scene 6.1

Loss of biodiversity, land cover change, and pollution represent direct, regional human impacts to the Great Lakes ecosystem.

But humans are also causing changes on a global scale that influence the Great Lakes region

Gases like carbon dioxide and methane have been produced by human activities since the industrial revolution

These gases act just like a greenhouse - trapping heat from the sun’s energy

Over recent decades, annual average temperatures have been steadily increasing,

Continuous long term weather station observations allow us to understand where and when the climate is changing.

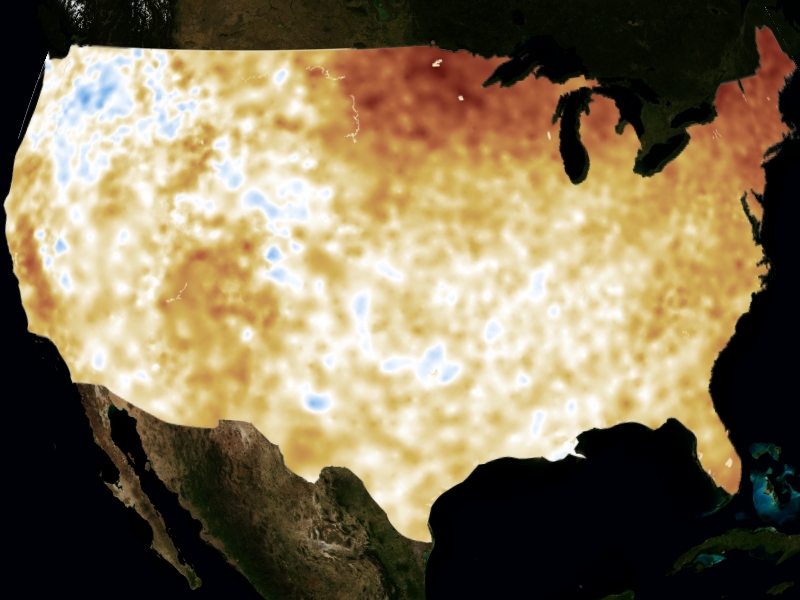
This map by the National Oceanic and Atmospheric Administration compares the last decade to the average spanning 1950-1980. Red colors show areas that were warmer than average over those 12 years. Blue colors show cooler than average temperatures. The Northeast and the Great Lakes warmed more than the rest of the country. This is a features of high latitudes in general: we observe more warming farther north across the globe.

Sources

Temperature Anomalies

Ned has gridded 5x5km^2 for climate temperature anomalies: seasonal comparisons for this summer and spring to average.

Ned will create annual average temperature anomalies for 3 recent decades: 1980-1989, 1990-1999, 2000-2009 vs, a 1950-1980 baseline

Image prepared by Ned Gardiner using unpublished data from R. Vose, NOAA. Manuscript in prep (January 2014)

Scene 6.2.1, frame 1Scene 6.2.1, frame 2
Scene 6.2.1

Climate change is no longer a future scenario - it is already here, and happening now. Not only has a clear trend toward warmer temperatures already been documented, but its effects are already being observed.

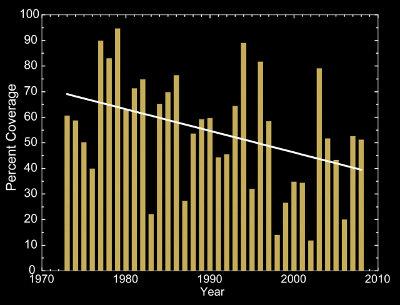
ICE COVER

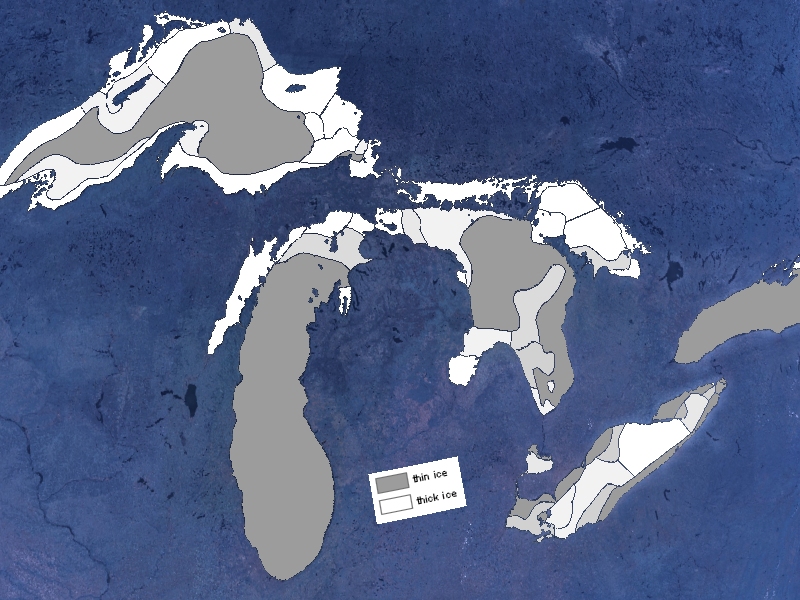
While weather is still highly variable from year to year, many clear trends emerge when looking across longer time frames. For example, over the last several decades, a warming climate has led to a declining trend in the winter ice cover over the great lakes.

Show only 1 year (1973).

Sources

Ice Cover:

http://globalchange.gov/HighResImages/12-Midwest-pg-119_top.jpg

(link to high resolution version of great lakes ice cover graph)

http://www.glerl.noaa.gov/data/ice/atlas/ice_duration/duration.html GLERL ice duration ‘73-’02 (ascii/png)

WMS shows average sea ice extent 1979-2007 http://nsidc.org/cgi-bin/atlas_north?service=WMS&request=GetCapabilities&version=1.1.1

linked from here: http://nsidc.org/data/atlas/ogc_services.html

icecover1973.kmz

12-Midwest-pg-119_top.jpg

duration.html

http://nsidc.org/cgi-bin/atlas_north?service=WMS&request=GetCapabilities&version=1.1.1

ogc_services.html

Scene 6.2.2, frame 1
Scene 6.2.2

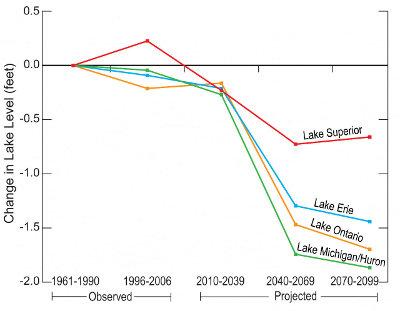
LAKE LEVELS

Higher temperatures lead to more evaporation. Reduced winter ice cover also increases evaporation. Reductions in Great Lakes water levels impacts shipping, infrastructure, beaches, tourism, and ecosystems.

The more greenhouse gases we emit into the atmosphere over this century, the greater the potential reduction in lake levels will be

Sources

http://www.glerl.noaa.gov/data/now/wlevels/levels.html avg water levels since 1860 (csv) via GLERL

http://www.glerl.noaa.gov/data/now/wlevels/dbd/

http://globalchange.gov/HighResImages/12-Midwest-pg-119_bot.jpg

levels.html

http://www.glerl.noaa.gov/data/now/wlevels/dbd

12-Midwest-pg-119_bot.jpg

Scene 6.2.3, frame 1Scene 6.2.3, frame 2Scene 6.2.3, frame 3Scene 6.2.3, frame 4
Scene 6.2.3

FUTURE WEATHER - MORE EXTREMES

Climate change is not only about increasing temperatures.

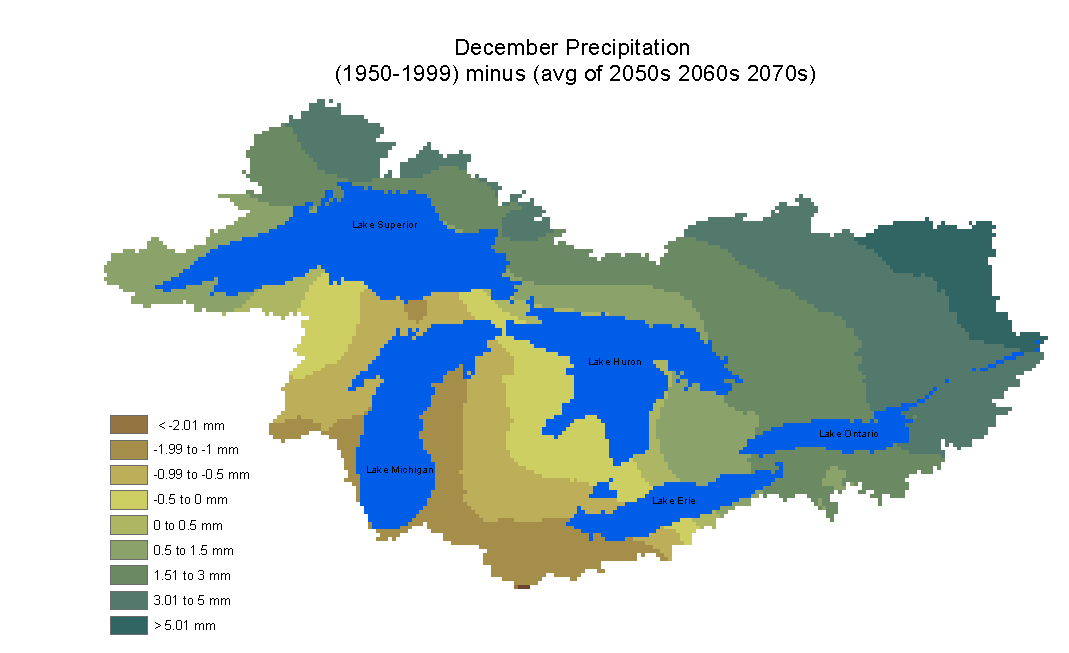
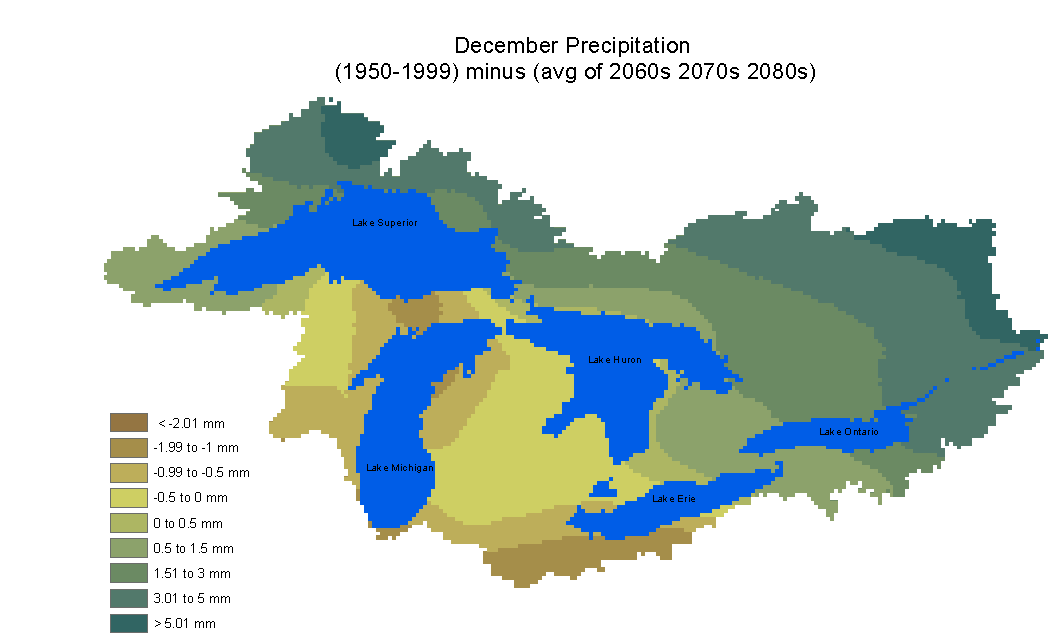
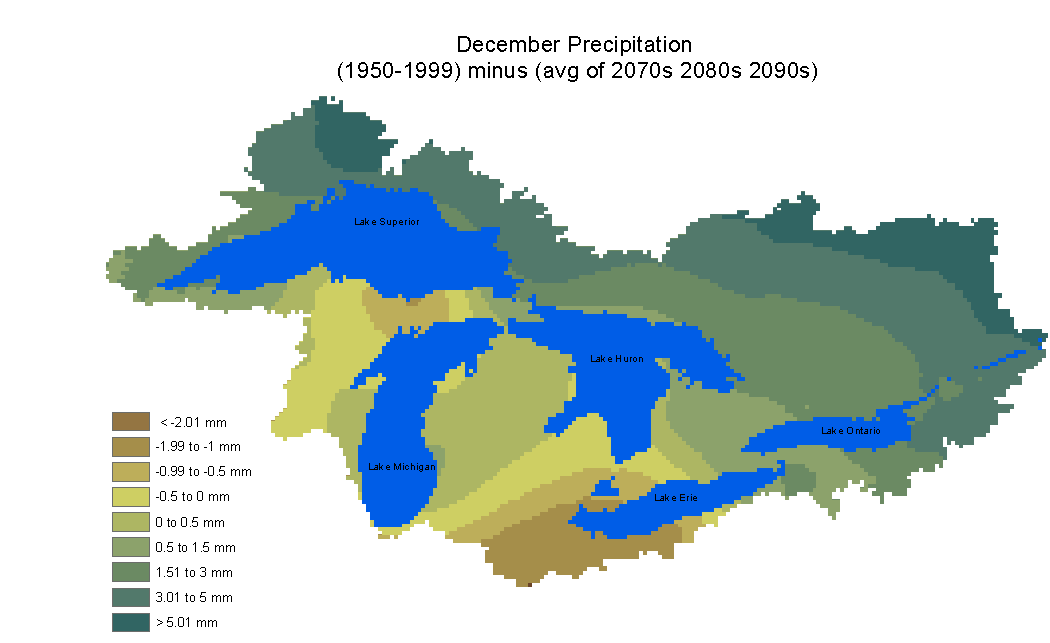
Climate models project that precipitation in the Great Lakes region will increase in winter and spring, with more moisture falling in intense storms. This pattern would produce more frequent flooding, more damage to infrastructure, and impacts on human health from flooding and water-borne diseases.

This time series of future projections from an average of 16 different global climate models shows steadily increasing amounts of precipitation in winter, relative to a 20th century baseline.

Recent trends toward increasing winter precipitation show that climate model forecasts are already occurring.

Sources

Climate data from Worldclim http://www.worldclim.org/download to include Canada (PRISM data do not include Canada, thus not used here)

http://www.worldclim.org/download

Scene 6.2.4, frame 1Scene 6.2.4, frame 2Scene 6.2.4, frame 3Scene 6.2.4, frame 4
Scene 6.2.4

CLIMATE CHANGE IMPACTS TO GREAT LAKES BIODIVERSITY

Climate change will increasingly impact the native biodiversity of the Great Lakes, upon which much of our economy and culture depends.

But there is much that can be done to prepare for the changes ahead, to the benefit of both humans and natural communities of the Great Lakes region

Restoring our watersheds will support clean water for people and healthy freshwater ecosystems for native species.

Protecting the mountains and forests at the headwaters of our rivers will remove carbon from the atmosphere, keep sediment from our lakes and rivers, and maintain habitat for forest dwelling animals.

Improving the health of wetlands will will sustain native fish populations, and will help both humans and nature cope with future flooding.

Taking care of biodiversity in a rapidly changing world is the best way to also take care of ourselves and our communities.

Sources

Additional source for images (Not currently used): http://www.nature.org/ourinitiatives/regions/northamerica/areas/greatlakes/index.htm

index.htm)

07

National Policies for Protecting Lakes

3 scenes
Scene 7.2.1, frame 1Scene 7.2.1, frame 2
Scene 7.2.1

Local Organizations Helping to Protect lakes (7 minutes)

Today, a great deal is being done to assist in management of this precious ecosystem and many people, scientists and citizens alike, are working to reduce the role that humans play in the destruction of the ecosystem.

There are many people working to face the challenges that are ahead of us concerning the Great Lakes. Of these organizations, NOAA is among the groups that is leading in research and activism regarding the Great Lakes watershed.

NOAA, and the Center for Sponsored Coastal Ocean Research (http://www.cop.noaa.gov) is conducting programs to study different stressors and external sources in the Great Lakes in order to better understand and identify the worst of the culprits and to determine sound solutions based upon their data. Some of these programs include Ecological Forecasting, Impacts of Multiple Stressors, Harmful Algae Blooms, and Invasive Species research.

All of these programs are interdisciplinary and give insight into the challenges faced by the watershed as a whole. NOAA provides opportunities for novice and expert alike to work together to explore the environment and come up with solutions together based upon combined knowledge.

Sources

http://huron-erie.org/maps.html

Remediation of Fish Spawning Habitat in the Huron-Erie Corridor (KMZ)????

Link to NOAA Logo

maps.html

Scene 7.2.2, frame 1Scene 7.2.2, frame 2Scene 7.2.2, frame 3Scene 7.2.2, frame 4Scene 7.2.2, frame 5Scene 7.2.2, frame 6
Scene 7.2.2

Some local organizations:

Huron River Watershed Council hosts events to raise awareness

National Wildlife Federation Great Lakes office

The Nature Conservancy

Action Item: Tyler and Matt will contact organizations to get stories and pictures.

Scene 7.2.3

Even if you are unable to participate directly with an NGO in cleaning rivers, lakes, and streams, you can help by making sure that pollutants don’t make it into the system in the first place. Helping with clean ups and recycling programs and public awareness.

Changes don’t have to be abrupt. Abrupt changes often result on resistance to change. Incremental changes that happen over time, but still have a significant impact, often produce better results. This can involve people at every level, from the individual, to local organizations, local and state governments, all the way to the National level.

08

Conclusion (1 minute)

1 scene
Scene 8.1

The Great Lakes and the surrounding watershed are the end result of millions of years of geological, biological, and cultural evolution. The water that came to the planet became a part of the planet-wide system. For most of time it remained unaffected by humans. When “we” finally come onto the scene (in Michigan as elsewhere) we immediately began to impact the environment in ways that we did not understand.

Much later when things got really bad, we realized that changes needed to be made. The Great Lakes and its watershed needed conservation and intervention. We found that we could impact the system in a positive way and now know that there is a great deal that can be done on the international, national, state, and local levels for the Great Lakes watershed. One model to consider is found in resilience science, which suggests that while there are long phases of the cycle where a system (like the Great lakes Watershed) will breakdown, there may exist only short phases of opportunity during which opportunities exist for a response. If this is true, then we appear to be in one of those short phases and we need to respond.

By facing the challenges ahead of us, and building a community that fosters caring for the environment, we can help save these precious resources that surround and sustain us.