Storyboard · WvN12

The Search for Water: Replenishing Watersheds in the Texas Drought

Visualize connections between oceans, climate, ecosystems, and drought to examine the importance of drought mitigation efforts for the wellbeing of current and future generations.

Premiered
September 14, 2013
Venue
Perot Museum of Nature & Science
Scenes
17
Last revised
November 7, 2013

Web version · Original script and storyboard (Google Doc) »

01

COSMIC SCALE (5 Minutes)

5 scenes
Scene 01A, frame 1
Scene 01A

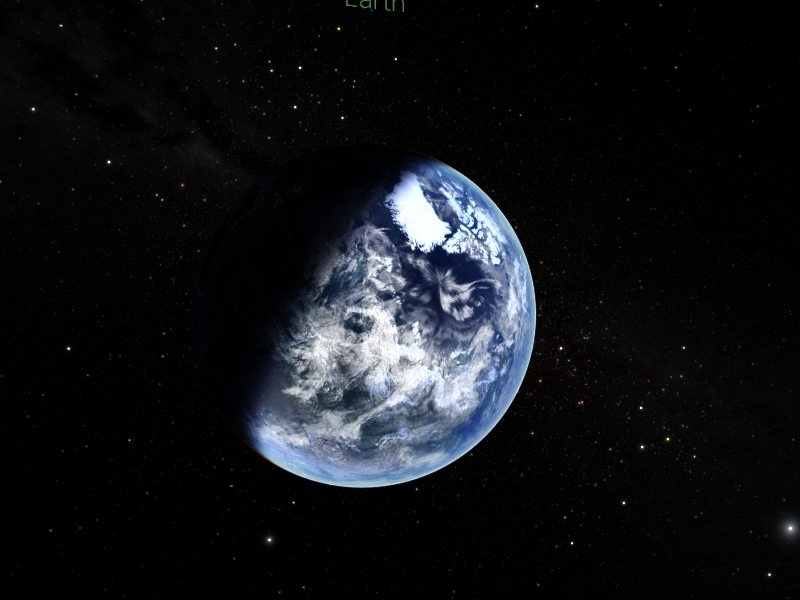
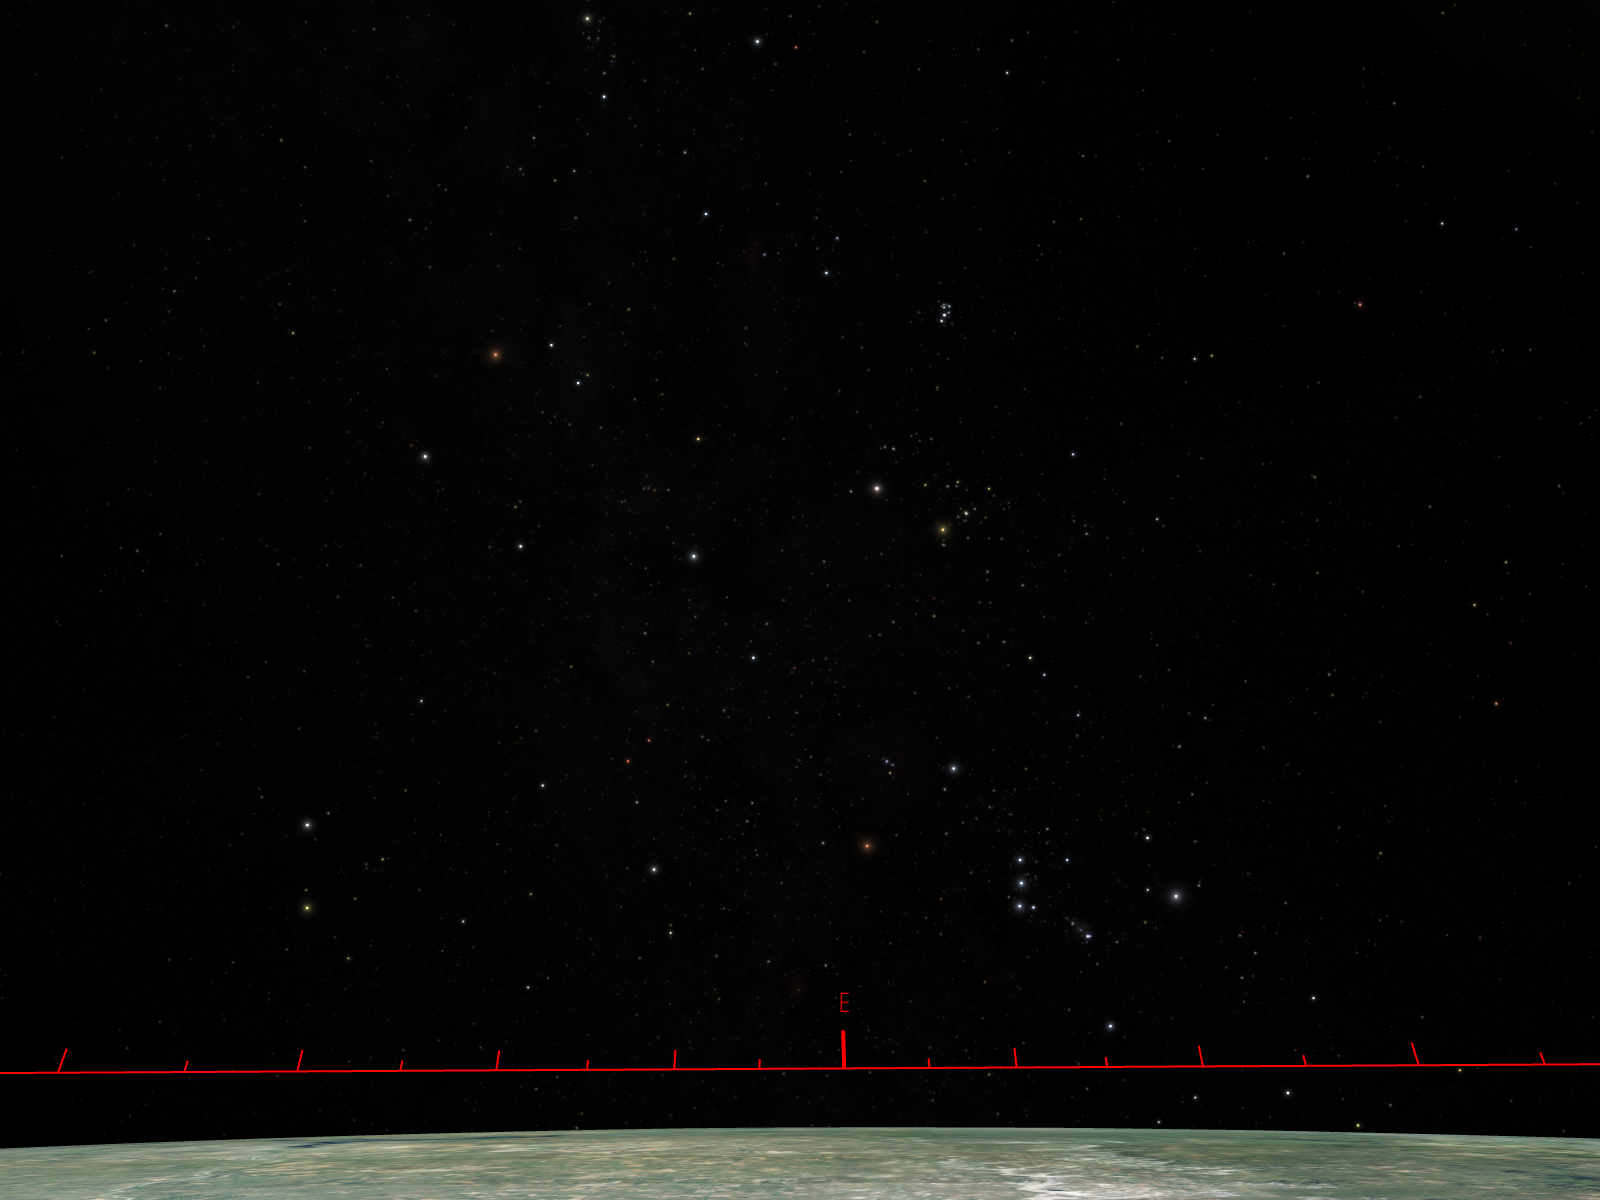
The story of water on Earth began in outer space.

We are part of the first generation to be able to view the Earth in total from the vantage point of space.

Today we understand that billions of years ago, our planet was bombarded with comets and asteroids. These collisions provided the water on our planet that today we often take for granted—2) a planet that orbits an average temperature star.

Uniview cues
1) Start at Earth (light in dome)
2) Fly out
Scene 01B, frame 1
Scene 01B

The Habitable Zone

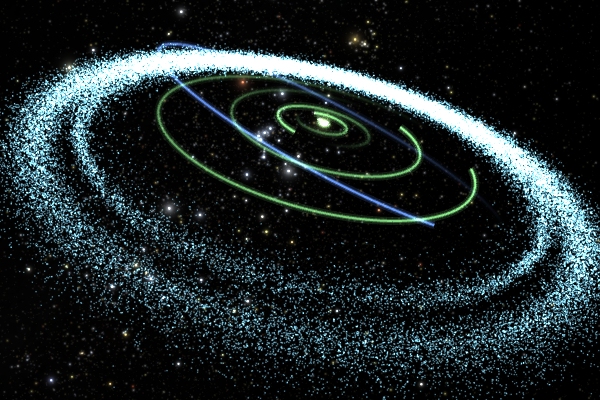
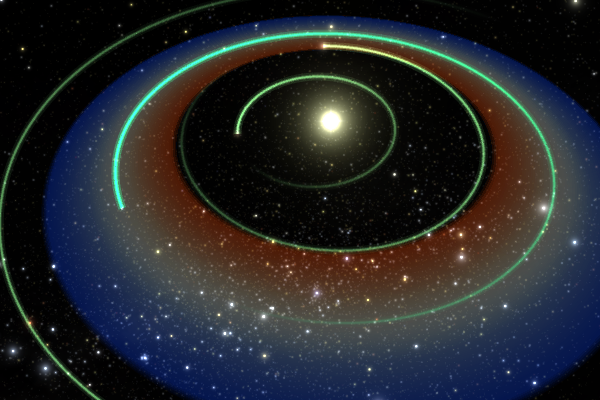
When we get into the inner Solar System, we see a visualization of its habitable zone, the region where liquid water can exist on the surfaces of rocky planets. Note that the Earth is right in the middle of the zone.

We think that Earth, Mars, and Venus actually started with similar conditions early in the Solar System’s history. However Mars’ and Venus’ locations at the outer edges of the habitable zone has allowed both of them to dry out. Mars has evolved into a cold dusty desert world, while Venus has a surface hot enough to melt lead.

Uniview cues
Custom Events:
8_HZ: Turn on habitable zone, and leave inner planet orbits on.
PlanetFX toggle
Scene 01C, frame 1
Scene 01C

Water in the Solar System

As we travel further away from Earth, we see the Kuiper Belt, a toroidal band of several billion icy bodies that lie outside the orbits of Neptune and Pluto. These are the remnants of planet formation, leftover debris from the early Solar System.

These bodies, along with many icy moons of the outer planets, contain substantial amounts of water – more than 99% of the water in the Solar System. But the water here is frozen, and inaccessible to life.

Uniview cues
Custom Events:
7_SolSystem: Manually fly past Kuiper Belt.
Scene 01D, frame 1
Scene 01D

The Cosmic Picture & Earth as a Water Planet; It’s in the magic place for liquid water.

Solar system

Stellar neighborhood

Galaxy

Nearby galaxies

And…back (2)

Our voyage through the cosmos returns us back to the Earth, a blue marble that is an island in the sea of space. It has just the right conditions, with sufficient water, atmosphere, and active geology that has allowed life to evolve, persist, and thrive for billions of years. It has been, and for the foreseeable future, will be our only home in the Universe.

Scene 01E

Water on Earth

If a gallon represents all of the water on the Earth, then 3 shot glasses (or Dixie cups) worth is all of the freshwater. However that shot glass has two ice cubes locking up two thirds of the freshwater. Of the remainder, much of the water is subterranean. The accessible surface water is equivalent to a single M&M.

Despite its seeming abundance, the water that supports civilization is rare.

From our satellite view, we can see how humans have settled near water sources.

02

GLOBAL & CONTINENTAL SCALE (5 minutes)

3 scenes
Scene 02A, frame 1Scene 02A, frame 2Scene 02A, frame 3
Scene 02A

Weather Patterns & Water

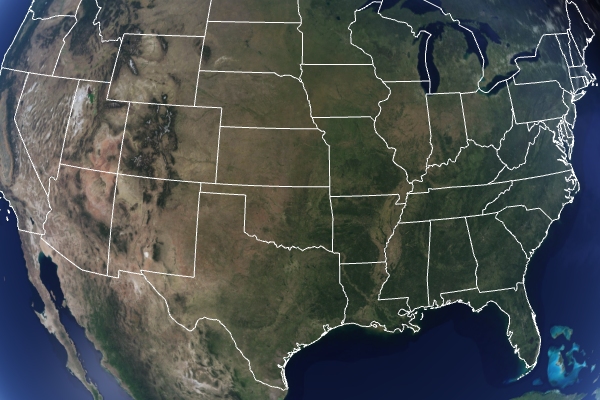
From here, we can see most of the US. (Point out features).

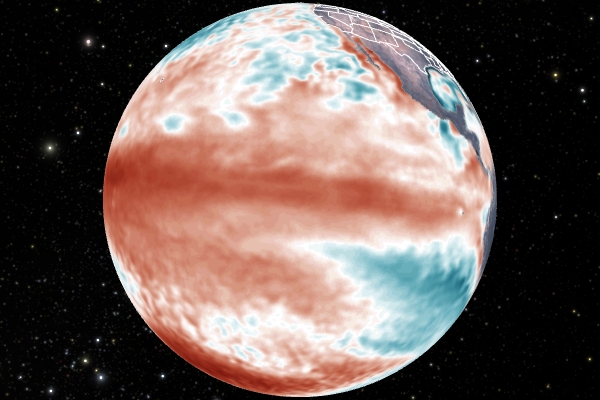
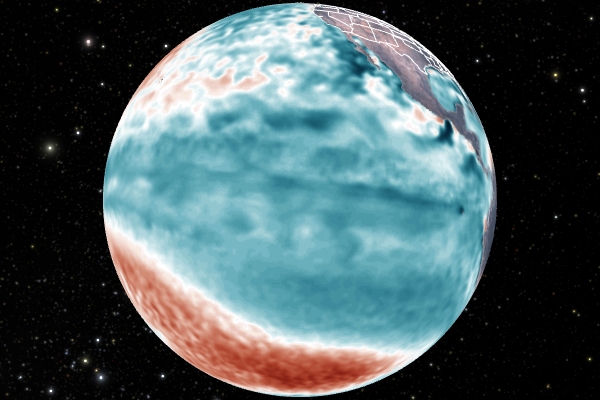
Precipitation, and hence runoff and reservoir storage, are highly variable in Texas and the arid southwestern United States. Rainfall is driven largely by air masses moving from the Pacific Ocean eastward. When the Pacific is warmer than average, there tends to be more moisture in the mid-latitude jet stream, and this brings more rainfall, especially in the winter months. This phenomenon of warmer-than-average ocean temperature in the Pacific Ocean is known as El Nino. The opposite phase is called La Nina and is typified by cooler-than-normal Pacific temperature and drier winter conditions throughout the southern United States.

During El Nino-neutral years, Texas tends to experience colder temperatures. What type of weather pattern might be occurring in the Pacific this winter?

The temperature of the Gulf of Mexico waters is of paramount importance throughout Texas and the southwest, especially during the summer months when the “North American Monsoon” (http://en.wikipedia.org/wiki/North_American_Monsoon) brings a critical influx of precipitation. If the gulf is cooler than normal, the monsoon is weaker, and this area gets less rainfall than normal.

Sources

Nielson-Gammon, John, “The Climate of Texas” at http://climatexas.tamu.edu/files/osc_pubs/climate_of_texas.pdf includes factors influencing climate of Texas. The proximity of the Gulf of Mexico influences Texas climate throughout the year, but especially in summertime when air moves inland from the gulf.

CLIMATE PREDICTION CENTER/NCEP/NWS

and the International Research Institute for Climate and Society, 6 February 2014, “EL NIÑO/SOUTHERN OSCILLATION (ENSO) DIAGNOSTIC DISCUSSION” show El Nino Neutral for February 2014. Accessed at:

http://www.cpc.ncep.noaa.gov/products/analysis_monitoring/enso_advisory/ensodisc.pdf

climate_of_texas.pdf

ensodisc.pdf

Scene 02B, frame 1
Scene 02B

National Precipitation

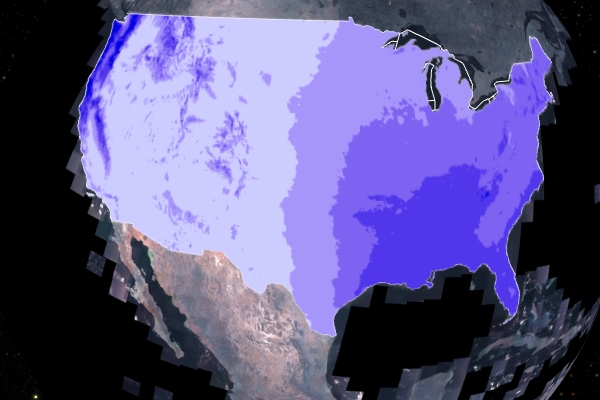
This map shows some essential features of the Earth systems forces that drive weather and climate in our nation.

The Pacific Northwest’s moist climate is controlled by prevailing winds-- the Jet Stream-- that bring a steady supply of moisture from the ocean eastward.

The interior of the country is in a rain shadow of mountain ranges and also sits within a persistent high pressure system that is set up by major convection patterns, called “cells”, in the circulation that brings heat energy from the tropics northward.

By the time air masses move from the tropics to the mid-latitudes (centered on 30 degrees, which you can point to with a laser pointer and which spans some of Texas), the moisture has already fallen as rain in the tropics themselves.

The moisture you see in the southeastern states comes from prevailing winds from the Gulf of Mexico and the Atlantic ocean, both of which have relatively warm water that easily evaporates and can be moved up into our continent.

Sources

Annual Precipitation

Scene 02C, frame 1
Scene 02C

Drought

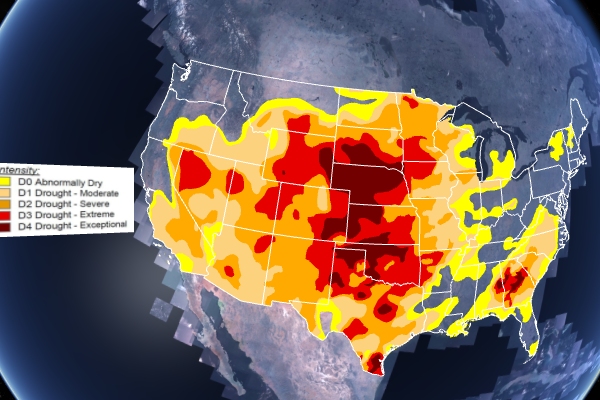
Since 2010, the western states have experienced one of the most persistent and pernicious drought cycles in our nation’s history. Texas bore the worst of several drought spates in 2011 and 2012, and you can see that during the summer of 2013, conditions did not greatly improve--despite greater than average precipitation to throughout the southwest.

When soils are dry, as during a drought, the land and air generally experience warmer-than-average surface temperature. That is because much of the heat of the sun goes directly to heating the atmosphere, rather than heating and evaporating water out of the soil. With no water to remove from the soil, in other words, all the sun’s energy goes to increasing the temperature of the air.

This may explain why Texas has seen a slight increase in temperatures. Interestingly, most of the heat records in Texas have come from overnight LOW temperatures. Those overnight lows simply don’t get down into the temperatures that allow people, animals, AND RESERVOIRS to cool off as much as they normally would.

All this heat means much more water demand and evaporative demand, both of which stress the stored water reserves in southwestern states.

Sources

NOAA Drought Monitor

http://droughtmonitor.unl.edu/

NOAA National Overview - July 2013 at http://www.ncdc.noaa.gov/sotc/national/2013/7 show the precipation in the southwestern US is above average for July 2013. Texas statewide precipitation shows as above average at: http://www.ncdc.noaa.gov/temp-and-precip/maps.php?imgs[]=Statewideprank&year=2013&month=7&ts=1&submitted=Submit.

Nielson-Gammon, John, “The Climate of Texas” at http://climatexas.tamu.edu/files/osc_pubs/climate_of_texas.pdf. Texas exhibits long-term variability for precipitation and temperatures. Temperatures seem to be increasing slight. Variability in rainfall may be explained by El Nino/La Nina.

http://droughtmonitor.unl.edu/

http://www.ncdc.noaa.gov/sotc/national/2013/7

maps.php

climate_of_texas.pdf

03

STATE & LOCAL SCALE (20 minutes)

7 scenes
Scene 03A, frame 1
Scene 03A

Texas Precipitation

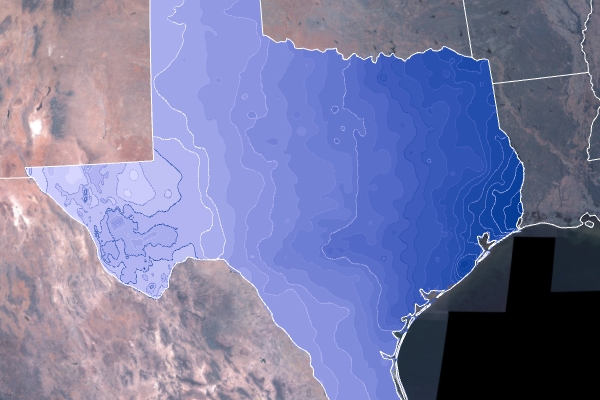
These factors (El Nino/La Nina, or El Nino Southern Oscillation-- ENSO ; as well as the North American Monsoon) combine to make the precipitation patterns over Texas highly variable. From one year to the next, it is not unusual for Texans to have a 100% variation in rainfall.

Despite the El Nino neutral year and rainfall this winter, 52% of Texas is experiencing drought (as of 13 February 2014).

The effects of drought are seen in our communities. In August of this year, two dozen Texas towns are on the Texas Commision on Environmental Quality watch list for running out of their water supply within 90 days. Dozens more are on the 180 day watch list. (TCEQ)

Last year, Spicewood, TX, ran out of water completely despite its proximity to Travis Lake. Today, 32500 gallons of water a day arrive by truck. (NPR)

While extreme precipitation changes are normal, Texas temperatures are increasing slightly over time (Nielson-Gammon). The higher temperature increases evaporation--aggravating conditions. The annual average temperature of DFW is about 4.2 degrees warmer than it was in 1895.

Sources

Texas Water Development Board - Weekly Drought Report, 2/10/2014, at http://www.twdb.texas.gov/newsmedia/drought/doc/weekly_drought_report.pdf shows weekly drought conditions for the state. Currently, this is 52% of the state. State reservoirs are 64% full. This report must be checked prior to every program for Perot staff.

http://climatexas.tamu.edu/index.php/data (for precip data)

http://www.twdb.texas.gov/surfacewater/conditions/drought/doc/Weekly_Drought_report.pdf

http://climatexas.tamu.edu/files/osc_pubs/climate_of_texas.pdf

https://www.tceq.texas.gov/drinkingwater/trot/droughtw.html

http://atmo.tamu.edu/weather-and-climate/weather-whys/613-el-nino-and-la-nina

http://droughtmonitor.unl.edu

http://stateimpact.npr.org/texas/drought/

http://stateimpact.npr.org/texas/2013/06/24/texas-community-without-water-still-waiting-for-a-solution/

Palmer Hydrological Drought Index (how much runoff is available from year to year)

http://gis.ncdc.noaa.gov/map/cag/#app=cdo

http://www.ncdc.noaa.gov/oa/climate/research/prelim/drought/phdiimage.html

weekly_drought_report.pdf

http://climatexas.tamu.edu/index.php/data

Weekly_Drought_report.pdf

climate_of_texas.pdf

droughtw.html

http://atmo.tamu.edu/weather-and-climate/weather-whys/613-el-nino-and-la-nina

droughtmonitor.unl.edu

http://stateimpact.npr.org/texas/drought

http://stateimpact.npr.org/texas/2013/06/24/texas-community-without-water-still-waiting-for-a-solution/

http://gis.ncdc.noaa.gov/map/cag/#app=cdo

phdiimage.html

Scene 03B, frame 1Scene 03B, frame 2Scene 03B, frame 3Scene 03B, frame 4
Scene 03B

Where can we find water?

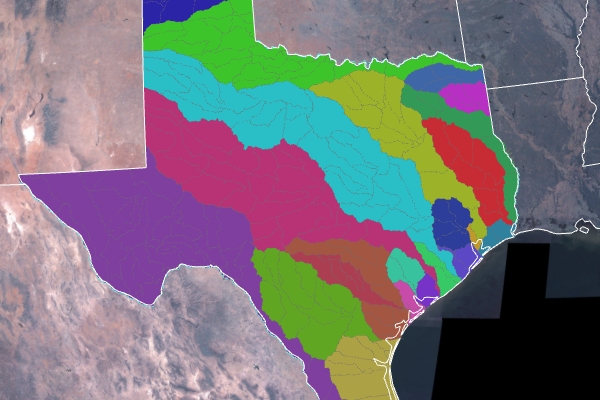
Water is bound by the geography of the land, flowing from high to low. (Hand example: if you make a bowl with your hand, and pour water into it, where will the water travel?)

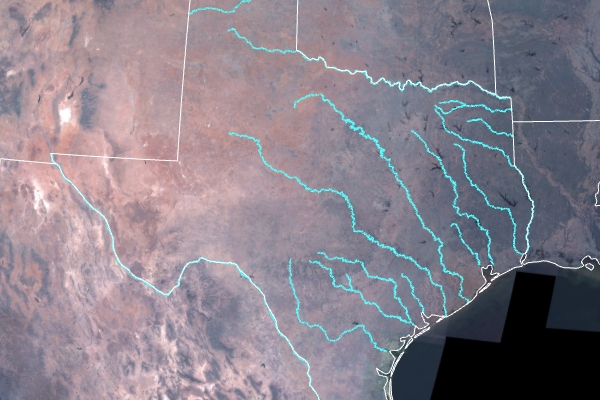
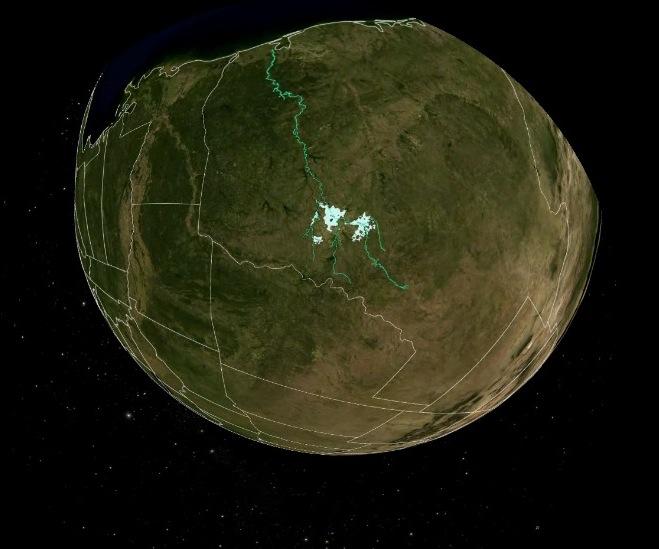
1) Water is separated by lands and travels into streams and rivers making up a watershed. In Texas, there are many watersheds in Texas--2) you can see how they associate with our rivers.

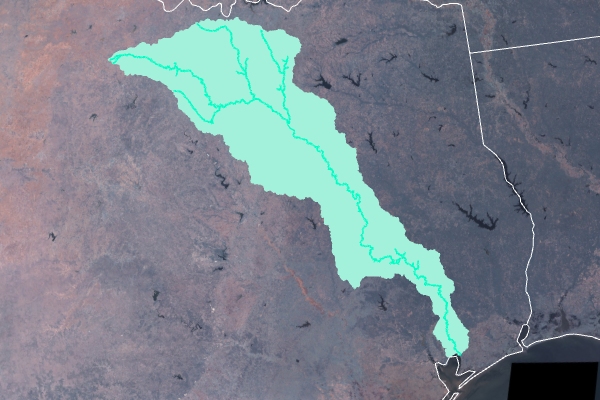
3) Dallas, Fort Worth, and the surrounding cities are in the Trinity River Watershed.

2)Trinity River is the longest river occurring completely inside Texas. It begins just south of the Texas-Oklahoma border and travels over 500 miles to Galveston helping to supply water for 1/3 of the state population.

Sources

(http://trinitywaters.org/trinity-river/trinity-river-basin-characteristics/

http://quickfacts.census.gov/qfd/states/48000.html

http://www.swf-wc.usace.army.mil/lavon/information/index.asp

Trinity River watershed and Texas major rivers data from National Hydrography dataset http://nhd.usgs.gov/data.html and Texas Region C website http://www.regioncwater.org/

http://trinitywaters.org/trinity-river/trinity-river-basin-characteristics/

48000.html

index.asp

data.html

http://www.regioncwater.org/

Scene 03C, frame 1
Scene 03C

Reservoirs:

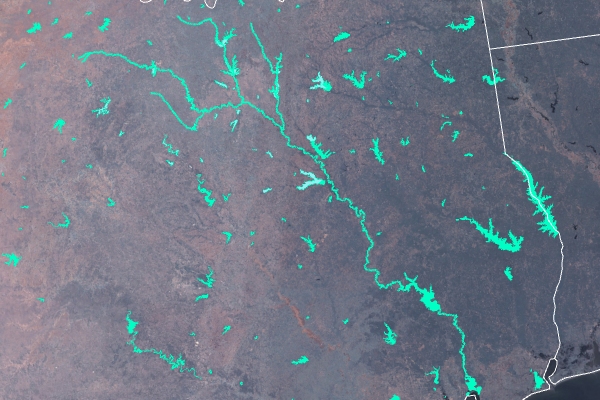
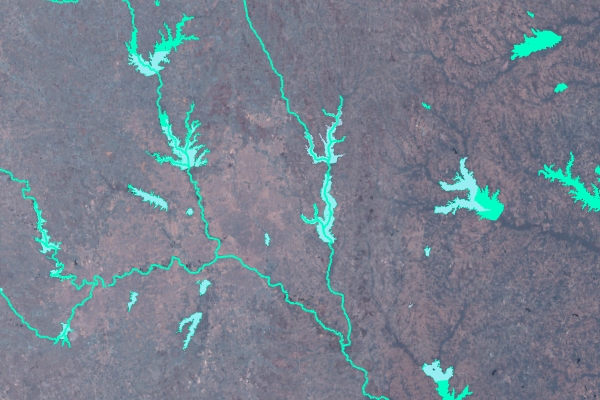
1) Trinity River travels through nearly a dozen manmade reservoirs including seven local lakes built by the US Army Corp of Engineers. You may recognize some of them--Grapevine, Lavon, Lewisville, and Ray Roberts. 2) All of the lakes we enjoy in Texas—with the exception of Lake Caddo, are man-made lakes.

Lakes help maintain water through the wide variability of rainfall. In rainy seasons, the lakes help to prevent flooding and in dry seasons they help to conserve water. All lakes are prone to drought because water evaporates from the lakes.

Unfortunately, lakes require monumental amounts of money. Lavon Lake alone cost over $88 million by its completion in 1975.

Sources

Major lakes and aquifers from Texas Water Board

http://www.twdb.state.tx.us/index.asp

index.asp

Scene 03D

Lavon Lake and our water region.

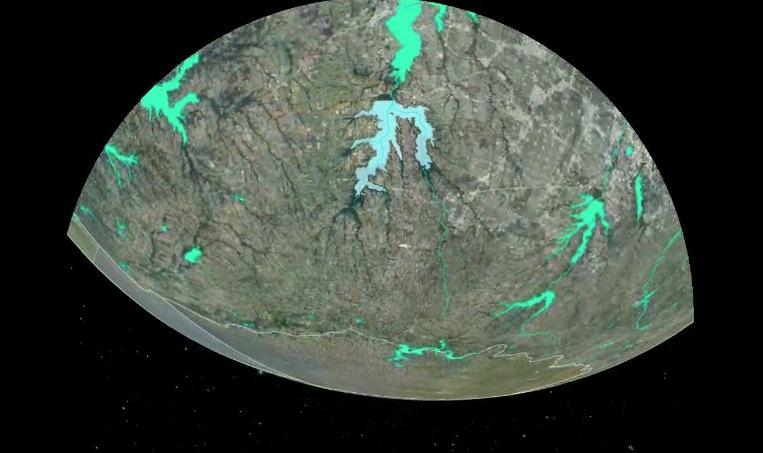
1) Lavon Lake is the water source for many cities throughout the Dallas area. Its water is provided to citizens by the North Texas and is licensed by the state of Texas--who owns all of the surface water in Texas.

Ninety-percent of the water taken from Lavon Lake and area reservoirs is used for municipal purposes.

2) To manage current water supply and to plan for future demands, Texas is divided into planning regions--3) with all of Dallas-Fort Worth within Region C.

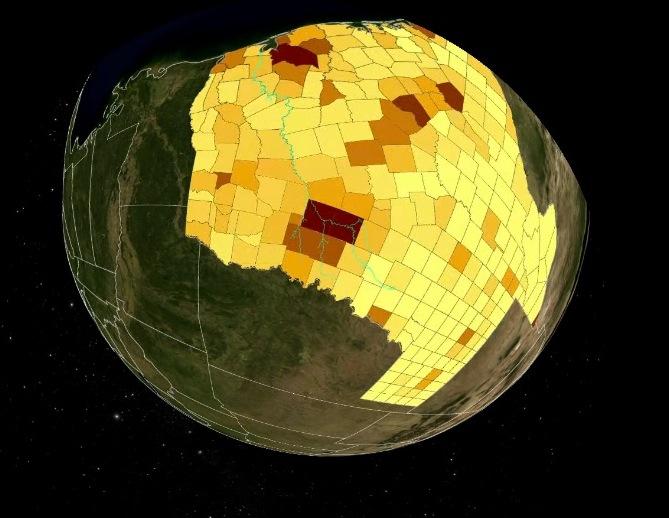
4) 25% of the entire state population lives here (Region C) consuming the water for food and drink, hygiene, and landscape irrigation. In the rest of Texas, irrigation for agriculture makes up the majority of water consumption.

Rainfall doesn’t necessarily mean a region will have water. 5) For example, rain in Dallas will not contribute to Lavon Lake due to the shape of the watershed. It must fall in McKinney, Texas to make it into the reservoir.

Sources

http://ntmwd.com/FAQ.html

Population density from census data http://www.census.gov/geo/maps-data/data/tiger.html

City boundaries from National Atlas http://nationalatlas.gov/atlasftp-1m.html

Texas regional water planning areas from personal communication with Erik O’Brian at Texas Water Development Board http://www.twdb.state.tx.us/index.asp

FAQ.html

tiger.html

atlasftp-1m.html

index.asp

Scene 03E, frame 1Scene 03E, frame 2
Scene 03E

Future projections for water supply

Texas population is expected to nearly double in the next fifty years. At this rate, the population growth for north texas would mean an additional Lavon Lake would need to be built once every ten years. Without it, the state could fail to meet water requirements and lose nearly 12 billion dollars annually.

Additionally, invasive species like zebra mussels and wild hogs further reduce supply. Water from Texoma lake is inaccessible due to the zebra mussel. E Coli from wild hogs harm quality.

The increase in demand coupled with the possibility of intensified drought conditions means Texans need a good solution--regardless of the weather.

Sources

http://www.twdb.state.tx.us/publications/state_water_plan/2012/06.pdf

http://www.twdb.state.tx.us/waterplanning/swp/2012/index.asp

http://stateimpact.npr.org/texas/2011/12/21/dallas-wastewater-keeps-trinity-flowing-houston-drinking/

http://nationalatlas.gov/streamer/Streamer/streamer.html

http://stateimpact.npr.org/texas/2013/07/12/where-we-stand-the-texas-drought/.

http://stateimpact.npr.org/texas/2013/07/19/texas-drought-forecast-to-continue-perhaps-for-years/

06.pdf

index.asp

http://stateimpact.npr.org/texas/2011/12/21/dallas-wastewater-keeps-trinity-flowing-houston-drinking/

redir.aspx

http://stateimpact.npr.org/texas/2013/07/12/where-we-stand-the-texas-drought/

http://stateimpact.npr.org/texas/2013/07/19/texas-drought-forecast-to-continue-perhaps-for-years/

Scene 03F, frame 1
Scene 03F

The Individual Picture

Determine how many gallons of water you use per day. The state of Texas water consumption goal is 140 gallons per person per day. 140 gallons looks about like a six-foot fish tank--or 1,120 16-ounce bottles of water.

At home, the water needed for landscaping is the highest drain on family water consumption. The Environmental Protection Agency (EPA) estimates 50% of this water is lost to misuse---over-watering, watering during high temperatures and losing supply to evaporation, and poorly aimed water fixtures.

Inside the home, the source of most water loss is generally a leaking toilet. Water loss here may not easily be detected if water is running silently; there are dye tablets that can be bought and dropped into the top tank to color water and make water loss more obvious.

EPA estimates the average home’s water leaks would fill a small, 10,000 gallon pool each year.

Sources

https://ntmwd.com/downloads/newsreleases/fixaleak_ntmwd_press_release_03122012.pdf

fixaleak_ntmwd_press_release_03122012.pdf

Scene 03G

These pictures, from Eric W Hodel, are from fifty miles north-east of Dallas. They show the effects of prolonged drought on our land, our reservoirs, and the life supported by this resource. Mr. Hodel watched as the lake near his own retreated and dried--and desiccated the life there.

Fortunately, there are ways our community can mitigate these effects.

John Bunker Sands Wetland Center

1 & 2 & 3) John Bunker Sands Wetland Center was completed near Seagoville in 2009 to help reclaim water. 4 & 5) The Wetland Center Diverts water from the East fork of trinity River to enter Wetlands. As the water flows through, sediment is deposited. Chemicals like phosphorous and nitrogen are filtered and enrich the plant life in the wetlands. 6) Water leaves the wetlands after a week and travels forty miles to the north side Lavon Lake where it is remixed with raw water supply. This process increases water supply by 20%.

Water quality is naturally polished as it passes through. Texas Stream Team records water as it passes through the Wetlands and allows a chance for citizen scientists to become involved not only at the Wetlands, but in their own neighborhood.

7) Wetlands are not only good for people. John Bunker Sands is allowing biodiversity to thrive. 8) They have recorded over 235 species of birds since February 2011. This year, they have a nest of bald eagles.

3) Though the physical footprint of the Wetlands is small versus Lavon Lake (about 1/7th of the size), it processes nearly the same amount of water per year. (102,000 square acre feet). Additionally, the Wetlands cost only a tenth of the amount of a new reservoir.

Uniview cues
1) Custom Event: Dallas Sky Pic
2) Cities.kmz
3) NAIP WMS
4) Texas_Major_Rivers.kml
5) Lavon_Lake.kml
6) Line from JBS Wetland to Lavon.kml
7) Custom Event: Wildcat
8) Custom Event: Eagles
Sources

http://www.wetlandcenter.com/

http://www.environmental-expert.com/news/new-study-by-florida-gulf-coast-university-professor-could-alter-ecological-management-340999

http://www.wetlandcenter.com/waterreuse/default.html

http://www.swf-wc.usace.army.mil/lavon/Information/index.asp

http://www.wetlandcenter.com/pressreleases.html

http://www.usinflationcalculator.com/

http://www.wetlandcenter.com/

http://www.environmental-expert.com/news/new-study-by-florida-gulf-coast-university-professor-could-alter-ecological-management-340999

default.html

index.asp

pressreleases.html

http://www.usinflationcalculator.com/

04

CONCLUSION (5 Minutes)

2 scenes
Scene 04A

Wetlands are pretty awesome!