Storyboard · WvN04

Where Condor Meets Eagle

Explore how visualizations can be used to catalyze discussions of how community health, environment, cultural traditions, and cosmologies unite the First Peoples of the Americas.

A draft planning storyboard. These are working notes for the Minnesota presentation, which was improvised with the visiting Bolivian delegation, so they do not record the program as it was delivered. Two frames (scenes 01 and 04) are sharper copies of the same visualizations from the Valley Oaks and Global Water storyboards, because the draft's own screenshots were tiny.

Premiered
March 2012
Venue
Bell Museum of Natural History
Scenes
14

Web version

01

Scenes

13 scenes
Scene 01, frame 1
Scene 01

[NOTE: A first pass by Joel: a cultural context WILL dominate the narrative. This aspect is not captured in this summary. Focus is on the data and science]

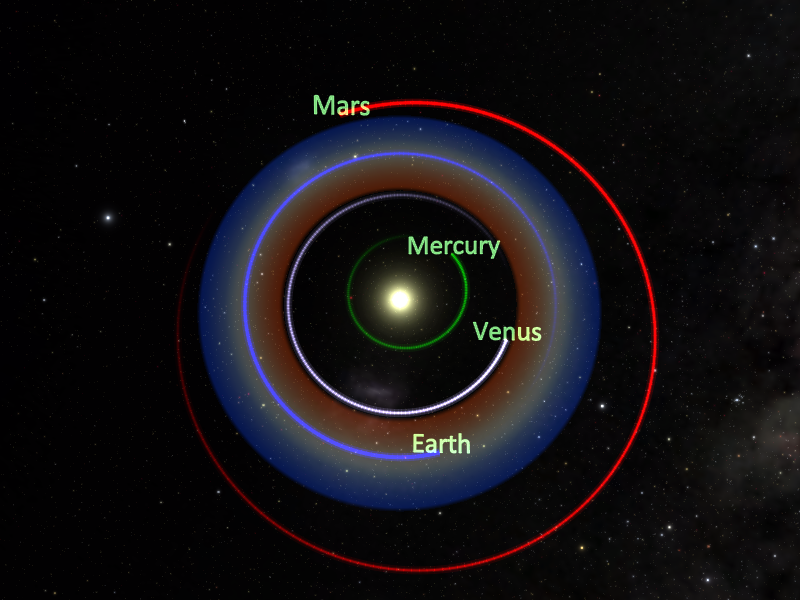
Begin with Welcome song to"Mother Earth". Take a mini cosmic tour to outside the Milky Way, with an emphasis on illustrating the boundaries for habitation (ie Habitable zones) within the Milky way and eventually the solar system. ID the “tipping point” where planetary system and planets within a system can not support life conditions as we know them,When we come back to Earth, we see that it is clearly well within the “safe operating” space of our solar system, unlike Mars and Venus. Here we describe some of the challenges for life and the necessity of water.

Uniview cues
Default UV set and:
MW Habitable zone
SS Habitable zone
Venus surf
Scene 03

Planet Earth has many interconnecting systems, which over millions of years, have established a state of equilibrium, which allows for what we might call a “Safe Operating Space” or "a life balance" in order for Earth to be habitual for humans. There are thresholds to these systems, if crossed threaten Earth’s habitability. Of course none of these processes occurs in isolation of the other, and in many ways acts as catalyst and drivers for the other. If we visit our planet at night from space, we notice how dominant the human presence is. we can see cities, oil fields, we can even make out fishing fleets in the sea. This incandescent footprint has exploded over the past 150 years, and we can see how we dominate our planet through our use of energy, clearly illustrated at night.

Uniview cues
Earth at night
Scene 04, frame 1
Scene 04

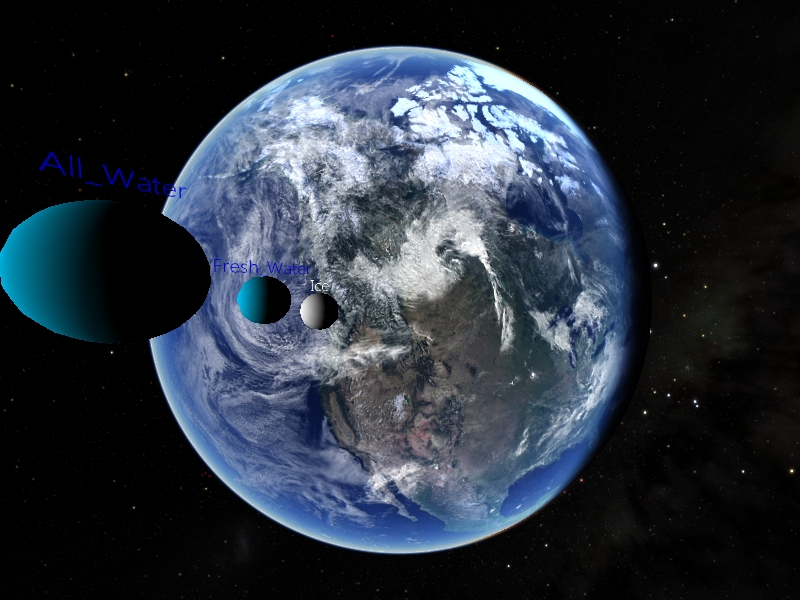
In the day time, we can also see how this human footprint mirrors the water boundaries of oceans, lakes (reservoirs) and rivers. Though freshwater only makes up 3.5% of this water and most of this water is frozen in glaciers and ice-caps (68.6%).It is this remaining water which is available to support life. Water is continually moving around, through, and above the Earth as water vapor, liquid water, and ice. In fact, water is continually changing its form. The Earth is pretty much a "closed system," like a terrarium. This means that the same water that existed on Earth millions of years ago is still here. Thanks to the water cycle, the same water is continually being recycled all around the globe. It is entirely possible that the water you drank for lunch was once used by mama Allosaurus to give her baby a bath.

Sources

DMNS Water Spheres

WATER_SPHERES/

Scene 05, frame 1Scene 05, frame 2Scene 05, frame 3
Scene 05

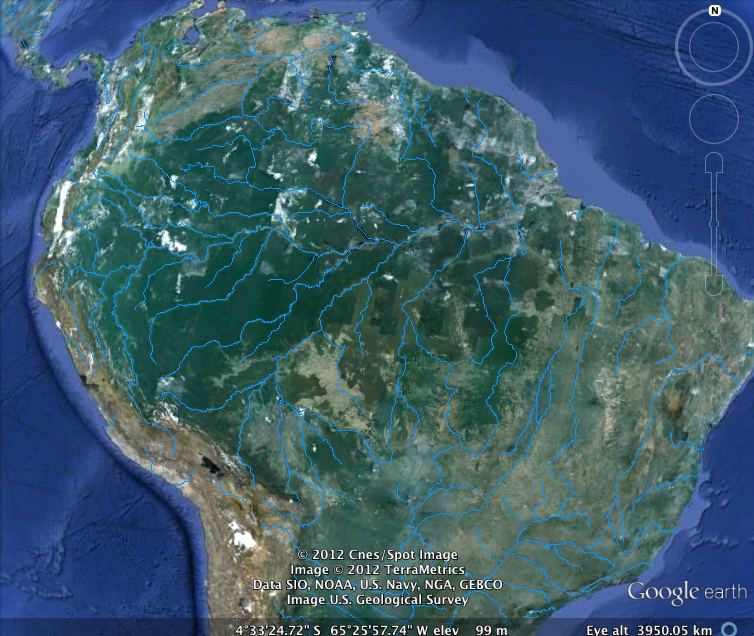
Where we live and where our ancestors lived depends on access to clean water. This finite resource supports all life, including over 7 billion people today. As we use this water to live, it continues it path through the water cycle either evaporating or following a path of least resistance down hill. When water leaves us, where does it go, and what are the impacts? If we look globally at the surface drainage, we can see the basins which drain the great river systems of the world. These rivers are the single largest renewable water resource for humans and are in crisis, suffering the impact of pollution, dam building, agricultural runoff, the conversion of wetlands and the introduction of exotic species. Nearly 80 percent of the world's human population lives in areas where river waters are highly threatened posing a major threat to human water security and resulting in aquatic environments where thousands of species of plants and animals are at risk of extinction. This impact is perhaps most pronounced, where these great rivers enter the ocean. In every case, they are marked by Dead Zones, Areas of low oxygen (hypoxic).Chemical nutrients carried down river (particularly nitrogen and phosphorus) cause a rapid explosion in the growth of phytoplankton based algal blooms, consuming the available oxygen in the water. This process known as Eutrophication, can be caused by natural and by anthropogenic factors. We all live somewhere along the water cycle path. Access to this precious gift carries both rights and a responsibilities.

Sources

USGS HYDROSHEDS

NASA GSFC

http://disc.sci.gsfc.nasa.gov/oceancolor/additional/science-focus/ocean-color/dead_zones.shtml

http://www.wri.org/project/eutrophication

WorldBasins.imageoverlay.kmz

worldrivers01.kmz

worldcountries01.kmz

Global Dead Zones.kml

dead_zones.shtml

http://www.wri.org/project/eutrophication

Scene 06

Let's move up stream to the headwaters of some of these great rivers. Many originate in our great mountain ranges. (Might start with a quick visit to the top of the world and the Everest pano)

Many of these great rivers originate from snow fields. Many of these snow fields are disappearing

From the Andes, the water flows to the Pacific and the Atlantic. In Bolivia the waters of the Andes flow through to the Amazon to the East, the Paraná to the south and the closed (Endorheic) basin of the Altiplano draining to Poopó Lake.and the worlds largest salt flats of the Salar de Uyuni

Sources

Blue Marble derived KML

Cryosphere_2004Jan.kmz

Scene 07, frame 1Scene 07, frame 2
Scene 07

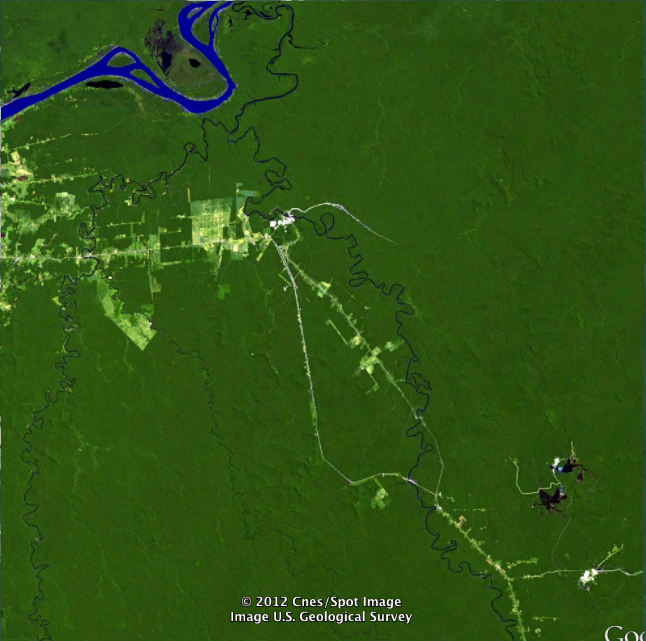
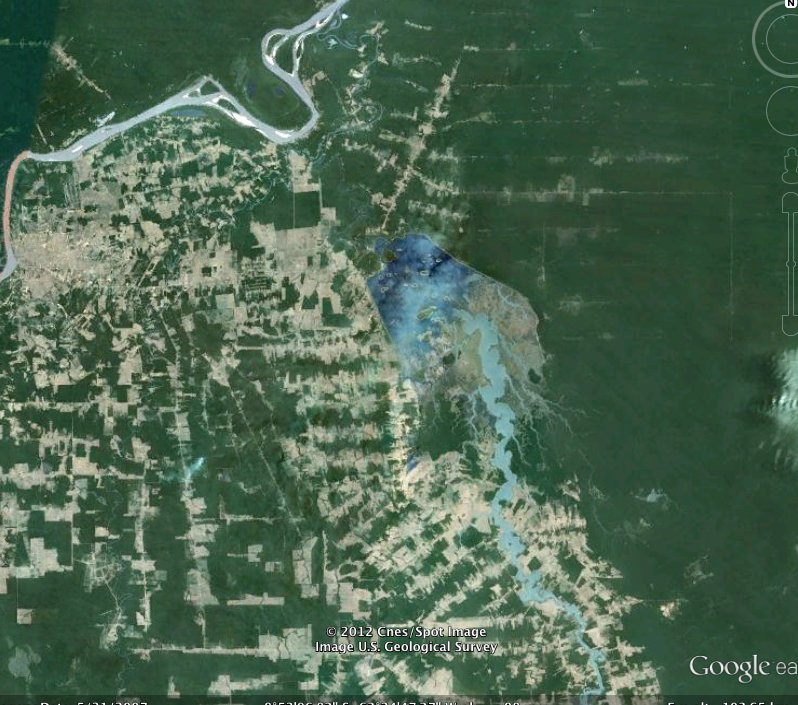
This is in the Brazilian state of Rondonia in the southwestern Amazon Basin. This state is bounded to the north by the Madeira River, which originates in the Andres in Bolivia and Peru. The site of a large Brazilian resettlement project, started in the early 1970s. If you look really closely at this LandSat satellite view from 1975, you can see a new road, which is the start of this resettlement. If we fast-forward 26 years, we see this road spurs off more and more roads at the end of which, is a small clearing in the rain forest where we find a few cows. These cows are raised for beef and eaten in South America. This fish-bone pattern of deforestation is something we notice around the tropics, especially in this part of the world. This has changed the landscape from one that is bio-diverse to a mono-culture, subject to erosion

Sources

Landsat archive

GeoScope? WMS?

Rondonia 1984.kmz

Scene 08, frame 1Scene 08, frame 2Scene 08, frame 3
Scene 08

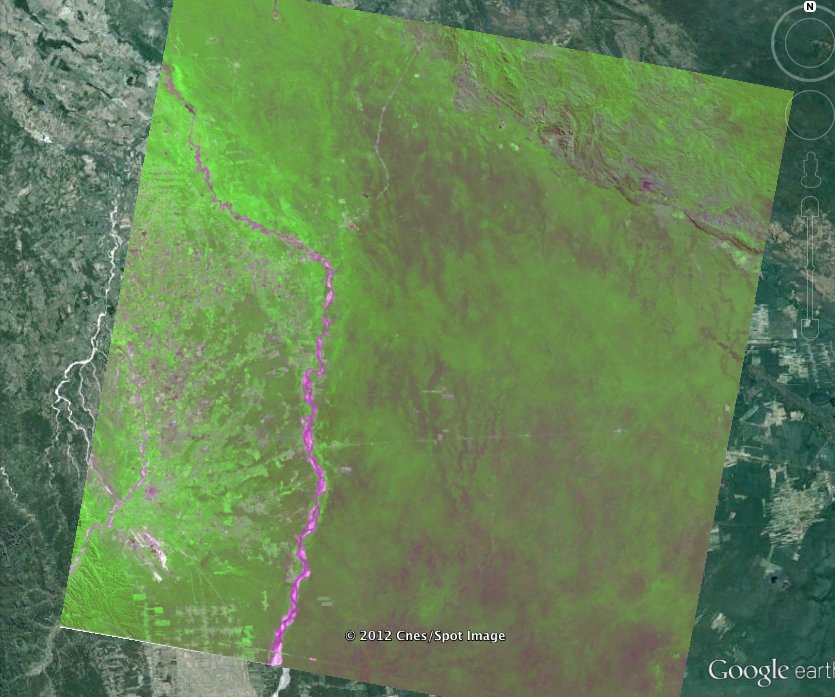
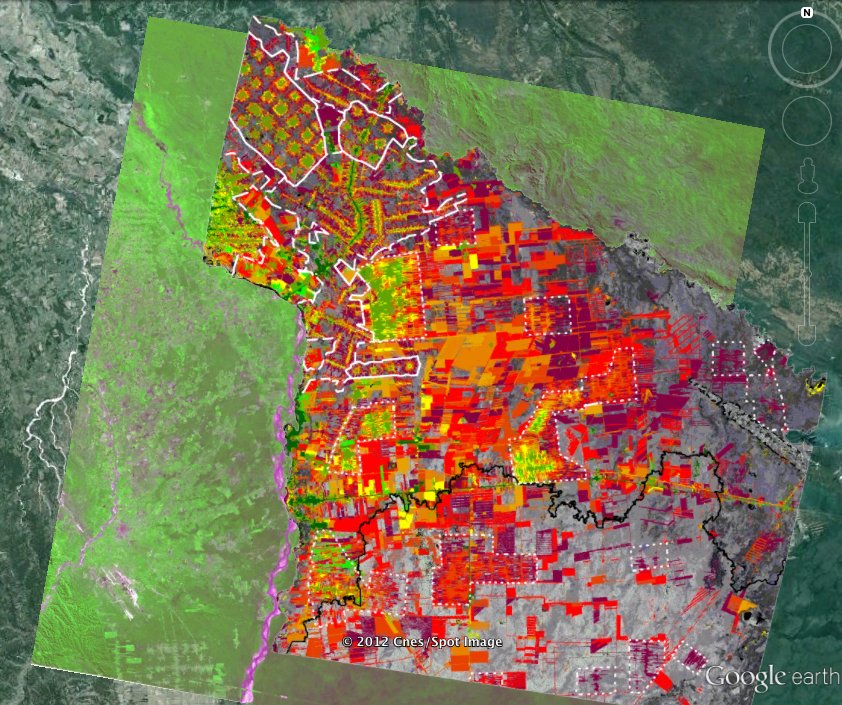
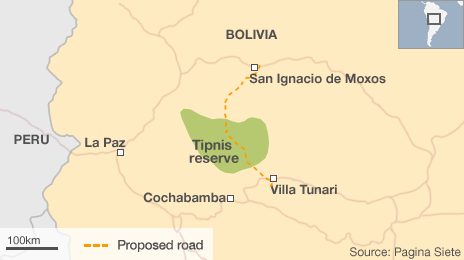
If we go a little further south through our 1975 satellite view, we are looking at the Bolivian edge of the Amazon. If you look really carefully, there is a thin white line where there is a lone farmer in the middle of the primeval jungle. If we fast forward 28 years, we can see that the landscape looks a lot more like Iowa then it does like a rainforest. In fact, what you are seeing here are soybean fields. These soybeans are being shipped to Europe and China as animal feed, especially after the mad cow disease about a decade ago, where we don’t want to feed animals animal protein anymore, because that can transmit disease, instead we want to feed them more vegetable protein, so soybeans have really exploded. Again changing the landscape from one that is bio-diverse to a mono-culture, subject to erosion [ During his first term in office, Evo Morales mandated food producers sell in the local market rather than export .[What are the implications of this policy?]

Sources

Landsat 1975, default symbology

Landsat coverage colour 1975 to 2000

Deforestation in Tierras Bajas, Bolivia.kmz

1975Tierras Baja_Bolivia.kmz

Tipnis Reserve, Bolivia.

Scene 09, frame 1Scene 09, frame 2
Scene 09

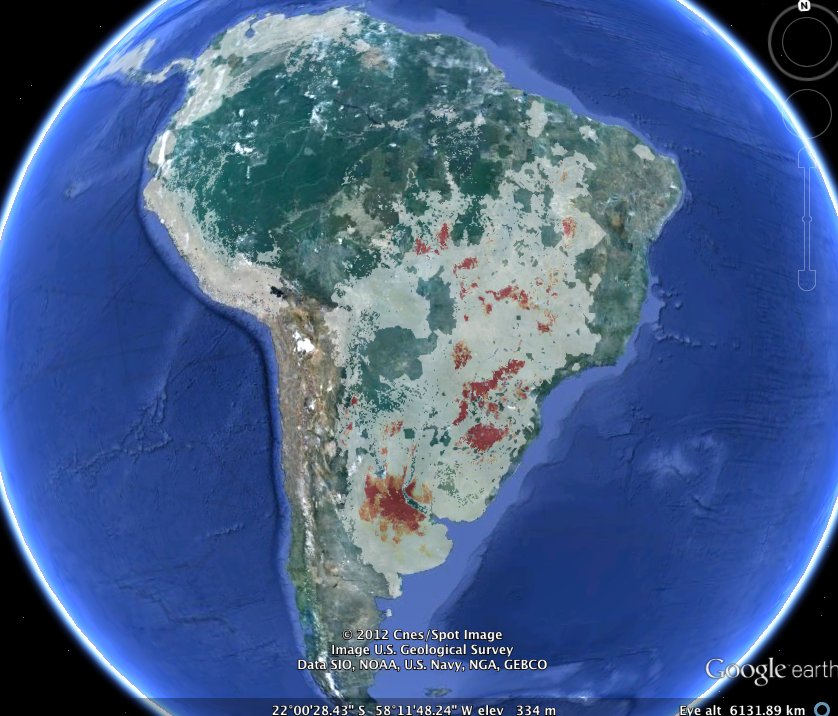
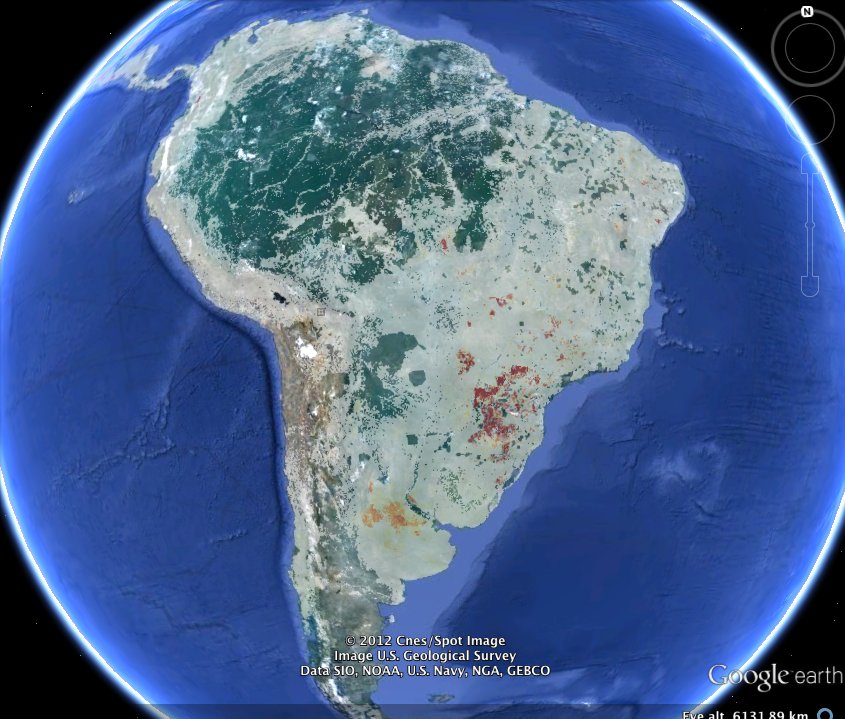
Around the world we see landscapes being altered for growing food and other crops. How much of the world is used for growing food, where is it exactly, and how might we change this in the future, and what will this mean? 16 million square km worth of land. All together in one place, it would be the size of South America. About 30 million square km, or about the size of Africa, is used for pastures and range lands . If we look at two crops, soy beans and corn. Two commodity crops that very trypical of both agricuture in Bolvia and MN.

Sources

IonE (year? 2000 legend? citation uploaded to dropbox)

Same as above

SoyBean_Area.kmz

Corn_Area.kmz

Scene 10, frame 1Scene 10, frame 2
Scene 10

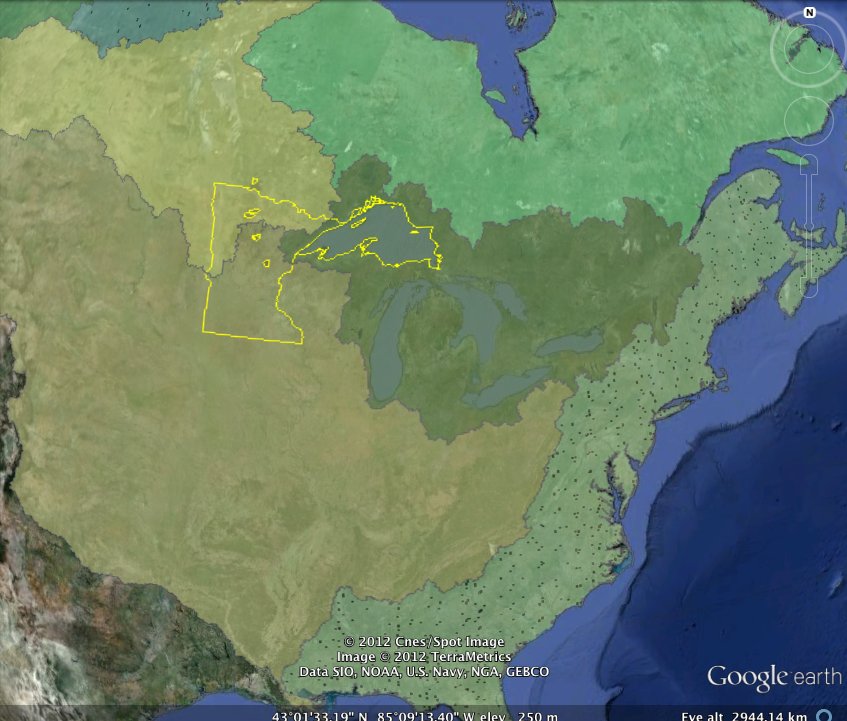
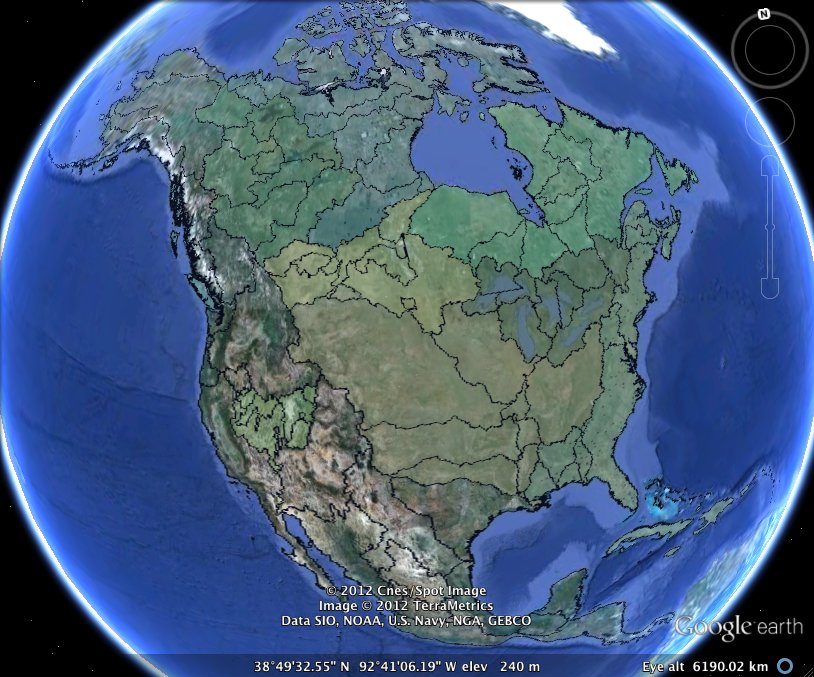
Lets move north - closer to where we are today. Minnesota is uniquely positioned straddling the trisection of 3 of the 4 major drainage basins of North America. As a result, surface water only originates in Minnesota, and only flows out of the state. This also means that Minnesotans are stewards of freshwater resources that flow down stream with impacts that reach Hudson Bay to the north, the Atlantic Ocean to the East, and the Gulf of Mexico to the south. Not a mountain boundary, but divide just the same.

With headwaters in northern Minnesota, the Mississippi River flows through the heart of America and is home to some of the most productive farmland in the world. But this success comes with a price. The very fertilizers, which help produce record yields, are also greening America’s waters, creating dead zones up river and down river.

Sources

USGS HYDROSHEDS

State boundary from Natural Earth

Lakes data from Global Lake Ecological Observatory Network

NAmer.basins.levelone.01.kmz

minnesotaandlakes01.kmz

NAmer.basins.leveltwo.01.kmz

Scene 11, frame 1
Scene 11

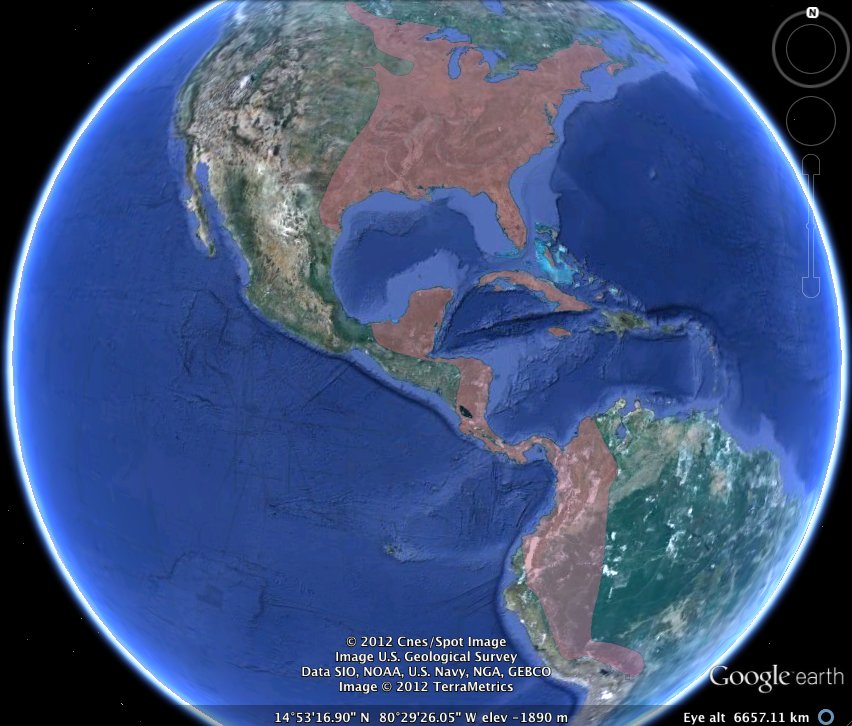
Bird migration pathway (MN to Bolivia): Scarlet tanager

Sources
Scene 12

Showing alqae blooms in the worlds largest eutrophic lake, due to phosphorus leaching 1. Satellite photos have revealed that “algae blooms” have often covered over 15,000 square kilometres of the lake. In 2006 the whole lake, nearly 25,000 sq/ km, was covered. That is a lot of green goop. 2. Lake Winnipeg is now the most nutrient rich and chlorophyll-laden lake of the top 10 lakes in the world; by far.

Sources

http://glovis.usgs.gov/

http://www.lakewinnipegresearch.org/

http://www.ourlivingwater.ca/2011/04/05/save-my-lake-3/

http://glovis.usgs.gov/

http://www.lakewinnipegresearch.org/

http://www.ourlivingwater.ca/2011/04/05/save-my-lake-3/

14

Water Lake Clarity

1 scene
Scene 15, frame 1
Scene 15

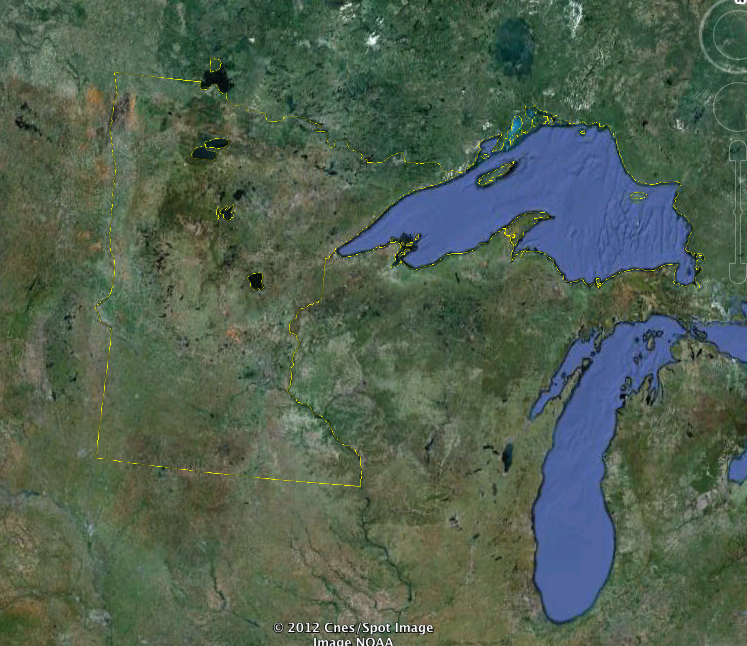
Minnesota state outline and 5 Major Lakes

Mille Lacs

Upper Red

Lower Red

Leach Lake

Lake Superior

Sources

http://lakes.gis.umn.edu/

http://water.umn.edu/index.html

http://lakes.gis.umn.edu/

index.html

State boundary from Natural Earth

Lakes data from Global Lake Ecological Observatory Network

minnesotaandlakes01.kmz