Storyboard · WvN01

A Global Water Story

Water is crucial for life on Earth, and its distribution across the surface determines where people can live. The availability of water is an active concern of many citizens in the western United States, who have seen firsthand the impacts of drought in recent years. Mountain snowpack, which supplies much of the water in Colorado and states reliant on Colorado River water, is expected to decrease as the climate warms. In the past, we have built large infrastructure projects to move water to supply our cities and farms. Today we need to look to innovative technologies to help address the water challenges of the present and future.

Premiered
May 24, 2011
Venue
Gates Planetarium, Denver Museum of Nature & Science
Scenes
37
Last revised
December 9, 2012

Web version · Original script and storyboard (Google Doc) »

01

Cosmic Scale

10 scenes
Scene 1.10, frame 1Scene 1.10, frame 2
Scene 1.10

Earth in a Cosmic Context

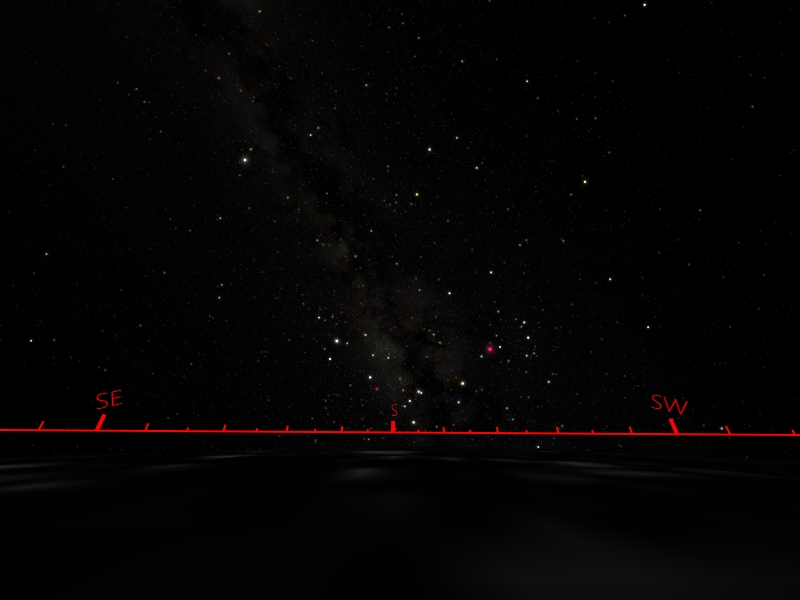
We start off at the surface of the Earth, looking up into the summer night sky. This is something our species has done for hundreds of thousands of years. Unfortunately in modern society where electric lights have erased the dark, many of us are unfamiliar with the night sky, and have lost connection to the patterns of the cosmos.

But that certainly wasn’t the case in the past. Our ancestors looked to and understood the sky. They knew about the cycles that were important to life: the motions of the Moon and Sun, the marking of the passage of the seasons; celestial events to tell them when to plant, to harvest, and when to follow the migration of animals.

They told stories to one another, to pass on the knowledge of the sky. As we sit here today, we are continuing that tradition, by sharing my knowledge about the cosmos with you.
Uniview cues
Custom Events:
00 Start: Set camera up at starting bookmark on surface of Earth.
Uniview Controls:
Turn on time to show nightly motions while talking about sky cycles.
Scene 1.15, frame 1
Scene 1.15

Summer Triangle

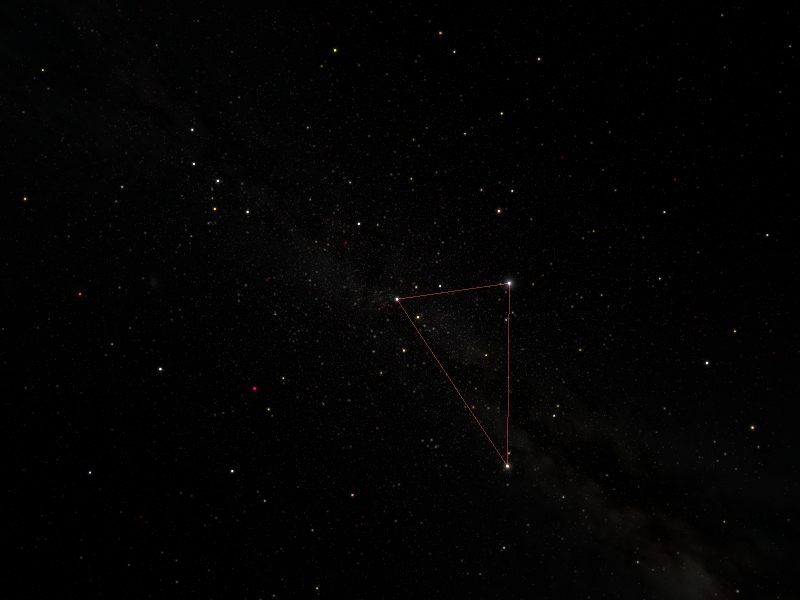
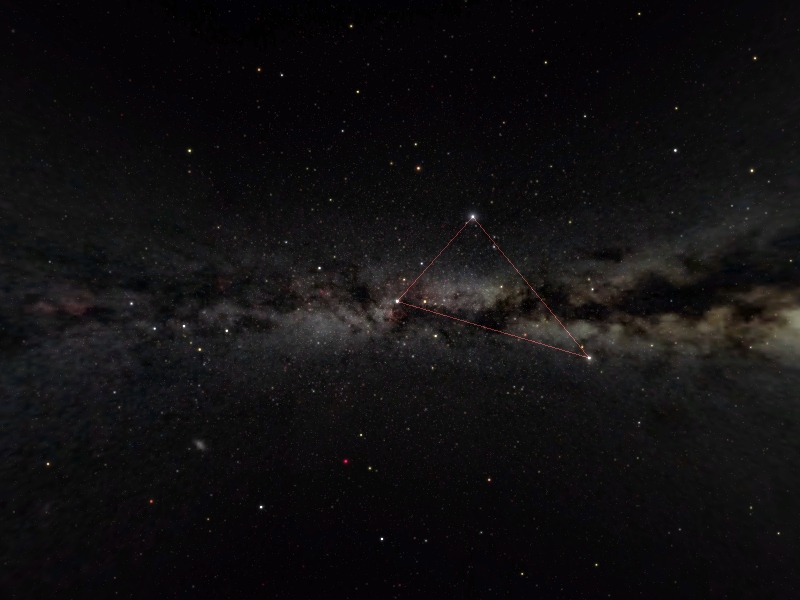
Above we see the Summer Triangle, marked by the brightest stars in what we know now as the constellations of Cygnus the Swan, Aquila the Eagle, and Lyra the Lyre.

Lascaux depiction

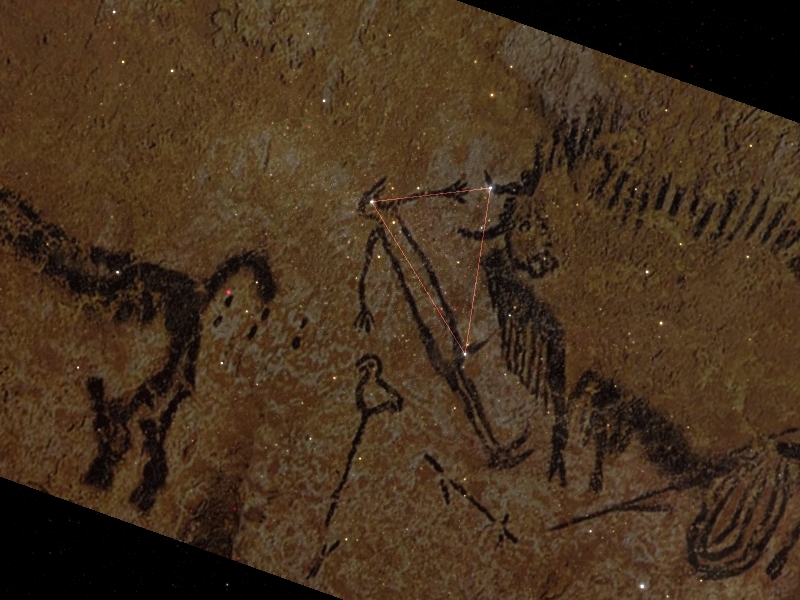
But there’s evidence that this and other patterns in the sky were noted by early humans long before the advent of agriculture. The earliest art-science collaboration could be from 17,000-20,000 years old from the Lascaux caves in France, with a depiction of the Summer Triangle as well as the constellation of Taurus.

Uniview cues
Custom Events:
1.1 Lascaux: Reset time.
1.15 Lascaux: Turn on Lascaux object.
Sources

Lascaux outlines based on Rappenglück, M. (2002). The Milky Way: Its Concept, Function and Meaning in Ancient Cultures. In T. Potemkina & V. Obridko (Eds.), Proceedings of the Conference “Astronomy of Ancient Civilizations” of the European Society for Astronomy in Culture (SEAC) associated with the Joint European and National Astronomical Meeting (JENAM), Moscow, May 23-27, 2000 (pp. 270–279). Presented at the Astronomy of Ancient Civilizations, Sternberg Astronomical Institute, Moscow, Russia: Mockba Hayka.

Scene 1.20, frame 1
Scene 1.20

The Sky Across the Electromagnetic Spectrum

In the modern era, not only have we continued to look at the sky, but we have used our latest tools to help us build a three-dimensional atlas of the Universe to allow us to understand it better.

Technological advances allow us to probe the electromagnetic spectrum beyond what is visible to our eyes. It is with these detectors that we find other connections with the cosmos.

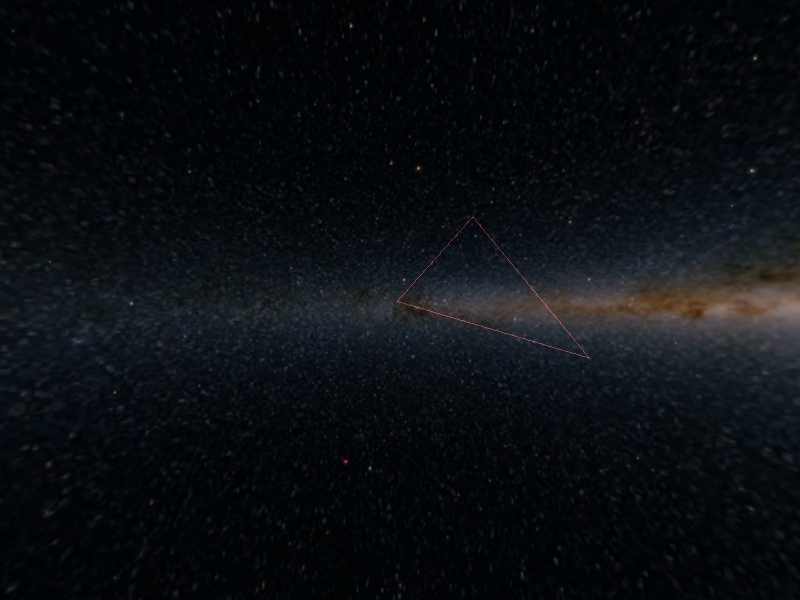
In visible light, our Milky Way Galaxy, home to our Sun and hundreds of billions of other stars, appears as a bright band, broken up by dark dust clouds in the foreground that block star light in the background.

Uniview cues
Custom Events:
1.2 Pivot Stars: Turn off Lascaux
Scene 1.25, frame 1Scene 1.25, frame 2Scene 1.25, frame 3
Scene 1.25

Our Origins from Star Stuff

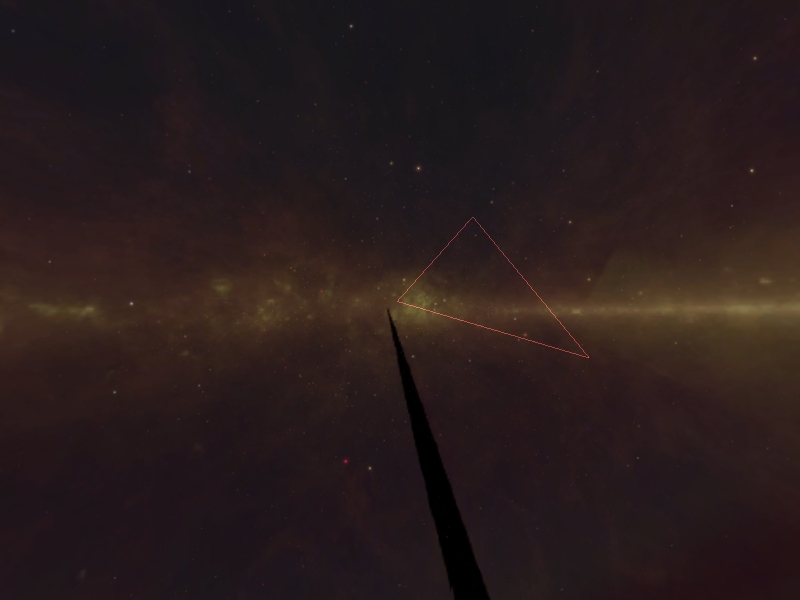
If we switch to viewing the sky in the near-infrared, the obscuration becomes transparent in many places. We can peer right through many of these gas and dust clouds, to see the band of stars that lay beyond.

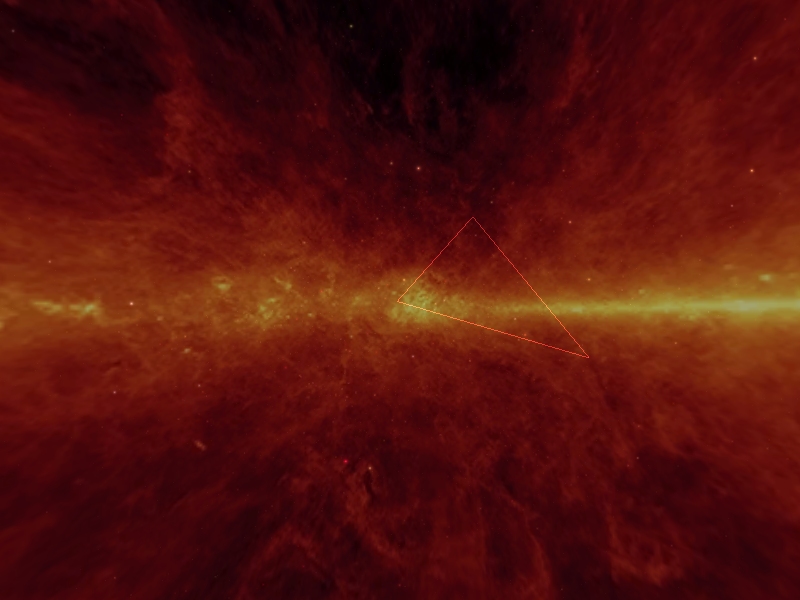
As we continue into the far infrared, the stars completely disappear since they emit little light at these wavelengths. Because they are relatively cold, the dust and gas clouds themselves start to glow in the far infrared.

We have learned that the cores of these clouds can collapse and form stars. It’s from something like these that our Sun and its family of planets was born 4.5 billion years ago.

Uniview cues
Custom Events:
1.2 2MASS: Turn on near-infrared 2MASS all-sky.
1.2 IRAScomposite: Turn on mid- and far-infrared IRAS all-sky.
1.2 FIR: Turn on IRAS far-infrared all-sky.
Scene 1.30, frame 1
Scene 1.30

Extrasolar planets

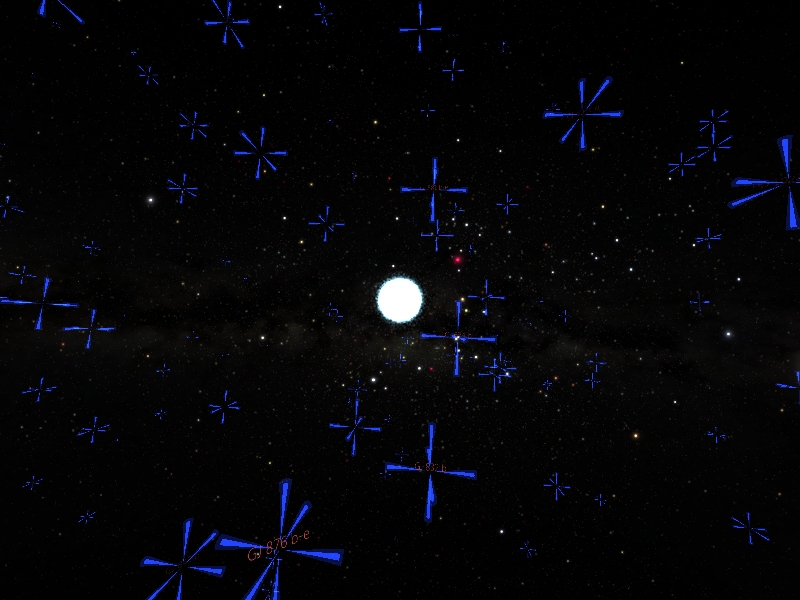
We also long believed that the processes that led to the formation of our Solar System was common throughout our Galaxy. In recent years, we have confirmed this with the discovery of planets around other stars. In the last fifteen years, over 500 planets have been found. Recent news from the Kepler satellite mission has added 1200 new potential planets.

Uniview cues
Custom Events:
1.3 Visible: Turn back on visible Milky Way; turn off all other layers. Turn on exoplanets.
Scene 1.40, frame 1
Scene 1.40

Supernova remnants

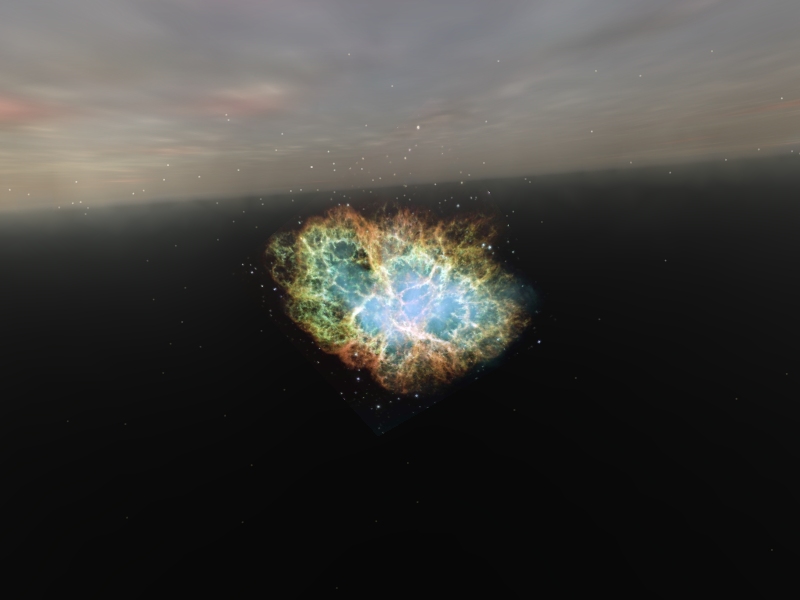
Our connection to the cosmos is not only through star birth, but also via the death of stars. Here is the Crab Nebula, the remnant of a supernova that was observed by Chinese and Arab astronomers in 1054 AD.

A supernova is the explosive death of a massive star. Except for hydrogen and helium, almost every other element has been forged inside a star. This includes the carbon, oxygen, and nitrogen that are found in organic molecules, and every other element heavier than those.

Supernovae explosions disperse these elements across the galaxy, where they can become incorporated in the next round of star and planet formation. We and everything we are familiar with are literally made up of star-stuff, elements that have been processed in the interiors of stars.

Uniview cues
Custom Events:
1.4 Target Crab: Turn camera lock to Crab Nebula.
1.4 Crab CloseUp: Fly up to Crab Nebula.
Scene 1.50, frame 1
Scene 1.50

Distance to Exoplanets

We fly back toward the Sun. As we do so, we note that these exoplanetary systems are vastly farther than any other place we’ve sent spacecraft to. At our current technology, it would take tens to hundreds of thousands of years to send a robotic probe to the nearest stars. It could be hundreds of years before it is even technologically and energetically feasible for us to develop probes to reach the nearest star within a human lifetime.

Uniview cues
Custom Events:
1.5 SolSystem: Set target to Solar System.
Uniview Controls:
After camera turns around, zoom back to the Solar System.
Scene 1.60, frame 1Scene 1.60, frame 2
Scene 1.60

Water in the Solar System

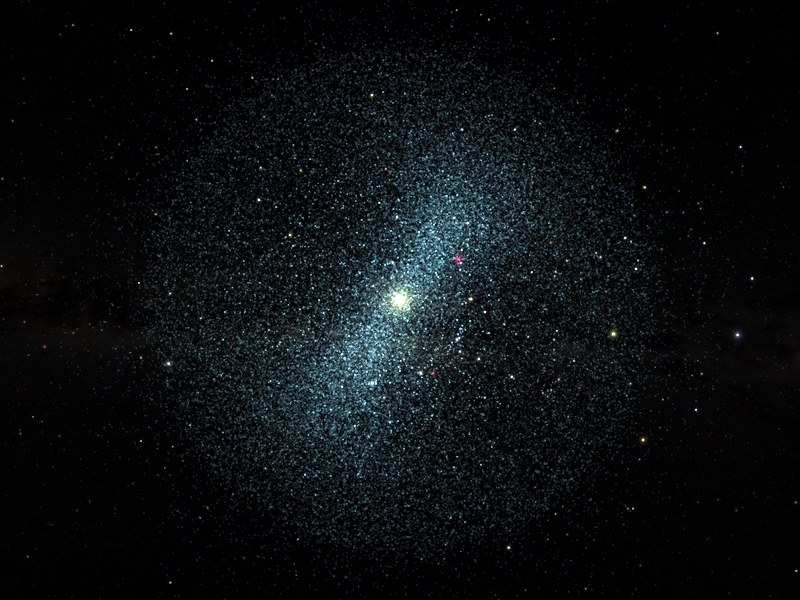
As we near the Sun, we fly through the Oort Cloud, a spherical shell of several trillion icy comets. Then we see the Kuiper Belt, a toroidal band of several billion icy bodies that lie outside the orbits of Neptune and Pluto. These are the remnants of planet formation, leftover debris from the early Solar System.

These bodies, along with many icy moons of the outer planets, contain substantial amounts of water – more than 99% of the water in the Solar System. But the water here is frozen, and inaccessible to life.

Uniview cues
Custom Events:
1.6 Exo OFF: Turn off exoplanets.
Uniview Controls:
Manually fly up to Oort Cloud, and then Kuiper Belt.
Sources

For a review, see T. Encrenaz, 2008, “Water in the Solar System,” Annual Review of Astronomy and Astrophysics, 46, pp. 57–87.

For asteroids contributing to Earth’s water, see Alexander, C. M. O'D., Bowden, R., Fogel, M. L., Howard, K. T., Herd, C. D. K., and Nittler, L. R., 2012, “The Provenances of Asteroids, and Their Contributions to the Volatile Inventories of the Terrestrial Planets,” Science, 337(6095), pp. 721-723. For cometary origins of Earth’s water, see Hartogh, P. et al., 2011, “Ocean-like water in the Jupiter-family comet 103P/Hartley 2,” Nature, 478, pp. 218–220.

Scene 1.70, frame 1
Scene 1.70

The Habitable Zone

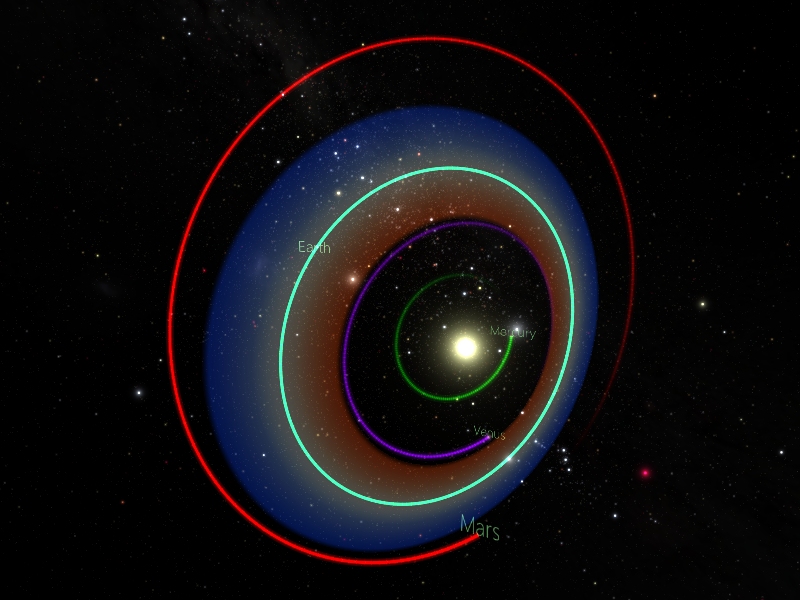
When we get into the inner Solar System, we see a visualization of its habitable zone, the region where liquid water can exist on the surfaces of rocky planets.

Note that the Earth is right in the middle of the zone.

We think that Earth, Mars, and Venus actually started with similar conditions early in the Solar System’s history. However Mars’ and Venus’ locations at the outer edges of the habitable zone has allowed both of them to dry out. Mars has evolved into a cold dusty desert world, while Venus has a surface hot enough to melt lead. Both planets are places that we have sent robots to explore. Perhaps people will travel to explore Mars as well in coming decades. But even it is too inhospitable. Colonization could be possible for no more than a few people, and at immense expense.

Uniview cues
Custom Events:
1.7 HZ: Turn on habitable zone, and leave inner planet orbits on.
1.7 HZ OFF: Turn off habitable zone and inner planet orbits.
Uniview Controls:
Continue to manually fly toward Earth.
Sources

Habitable zone marker for the Solar System, created by California Academy of Sciences and SCISS/AB.

Scene 1.80, frame 1
Scene 1.80

Earth is in Right Place for Liquid Water and Life

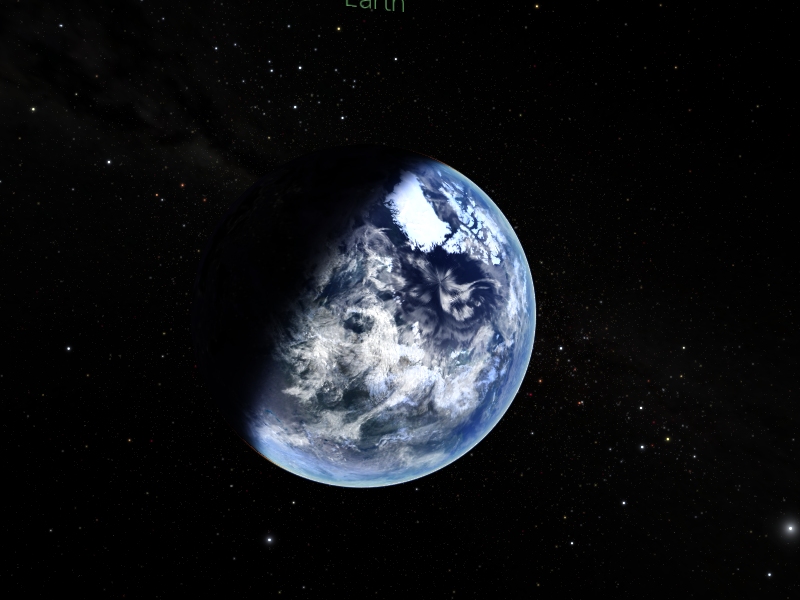
Our voyage through the cosmos returns us back to the Earth, a blue marble that is an island in the sea of space. It has just the right conditions, with sufficient water, atmosphere, and active geology that has allowed life to evolve, persist, and thrive for billions of years. It has been, and for the foreseeable future, will be our only home in the Universe.

We are part of the first generation to be able to view the Earth in total from the vantage point of space.

We are also the first generation to have satellites orbiting in space, and observing the Earth across the electromagnetic spectrum. Our spacecraft can look out to study the rest of the Universe, and help us understand our place in it. But they can be turned to look in as well, to allow us to better understand the interlocking systems of our home world, from the atmosphere to the oceans, the flows of water and rock, the cycles of biology and climate. And increasingly, our species’ growing impact on our world.

02

Global: Earth the Water Planet

2 scenes
Scene 2.10, frame 1
Scene 2.10

The M&M of Fresh Surface Water

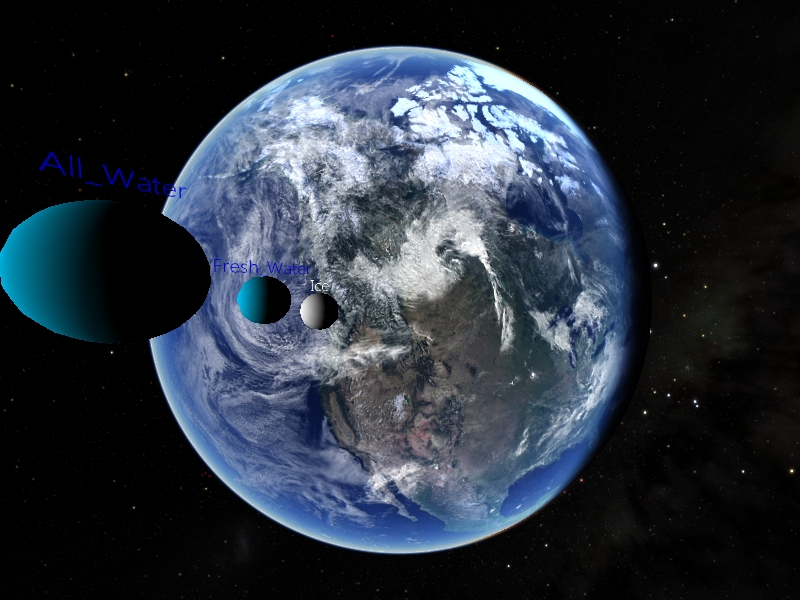
If a gallon represents all of the water on the Earth, then 3 shot glasses worth is all of the freshwater. However that shot glass has two ice cubes locking up two thirds of the freshwater. Of the remainder, much of the water is subterranean. The accessible surface water is equivalent to a single M&M.

We are going to give you an entire presentation about that M&M of liquid fresh surface water. We are going to talk about its distribution on the surface of the planet, from a continental scale, from a regional scale in the western part of North America, and then in our home region in Colorado and the Rocky Mountains. The primary message is that the freshwater is not randomly distributed: it is in patterns that we can understand and through our knowledge and our insight, we can better understand its distribution and make better use of it.

Uniview cues
Custom Events:
2.1 Water ON: Turn on water spheres.
2.1 Water OFF: Turn off water spheres.
Sources

From the USGS Water Science School webpage, How much water is there on, in, and above the Earth? with data derived from Igor Shiklomanov, 1993, “World Fresh Water Resources,” in Water in Crisis: A Guide to the World’s Fresh water Resources, Ed. Peter H. Gleick, New York: Oxford University Press.

Water sphere visualizations created by Ka Chun Yu.
water_sphere_kmls.zip

How much water is there on, in, and above the Earth?

Scene 2.20

Habitable Zones on Earth

We don’t live in the oceans. Not in the deserts, nor the poles. We actually live in a narrow range of habitats on the surface of the Earth, as well as within a narrow range of altitudes. (We don’t live in the clouds either, or at the top of the Himalayas.)
In fact the habitable zones of the Earth are small, and precious. Each one of them has a supply of potable water.

03

Continental: Distribution of Water

9 scenes
Scene 3.10, frame 1
Scene 3.10

Asia

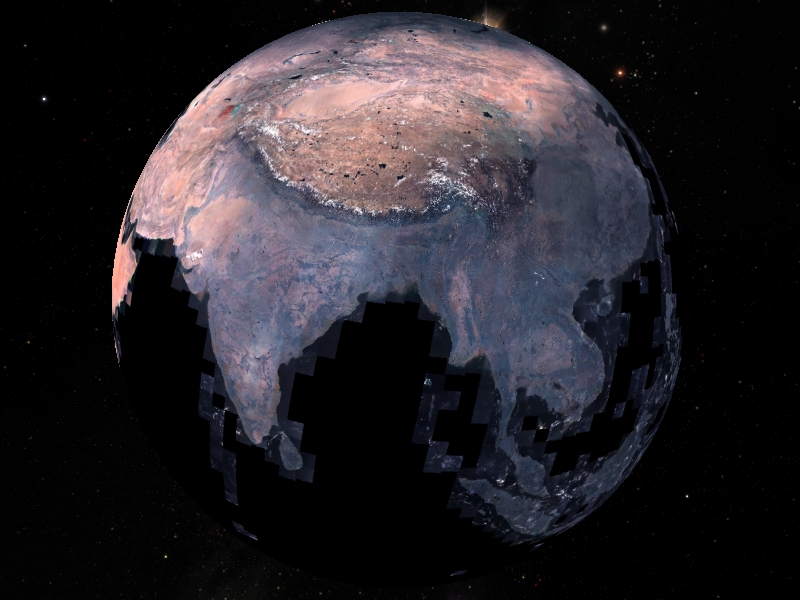
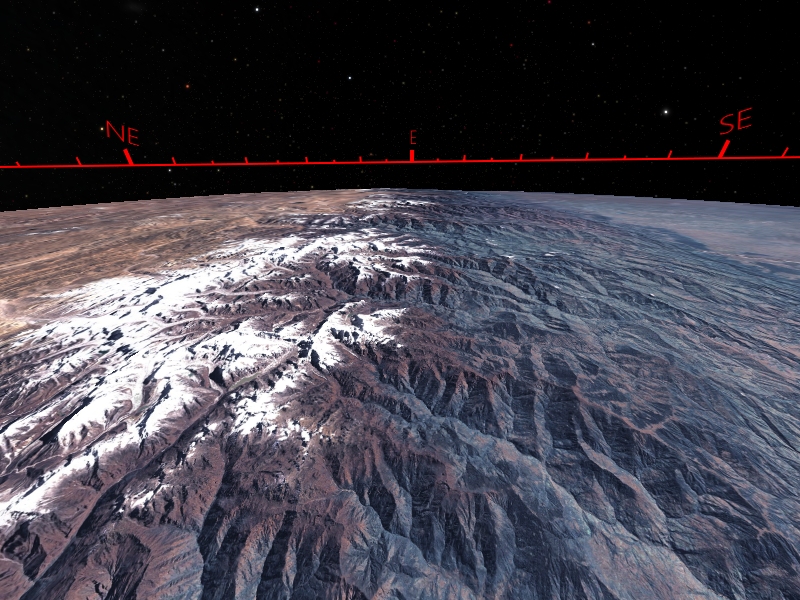
We see the sub continent of India below, the main Tibetan plateau up at the top with the Himalayan mountain chain in between. You can see a fundamental difference in the color of the surface of the earth: much of India, Bangladesh, indo-China, and much of the south China plain is in blues and greens in strong contrast with the Tibetan plateau and the Taklimakan desert up to the north. The difference of course is the presence of vegetation. Vegetation is a proxy for the presence of water. The vegetables grow where the water is and the people live where the vegetables are. At this distance from the Earth, you can start to see something like the habitable zone mentioned earlier is present here on Earth as well. There are places on Earth that are habitable, meaning you can live there, and places on Earth that are inhospitable, or almost uninhabitable. There are people that live in Tibet of course but not very many. If you walk around parts of Tibet, you will see a broad windswept plain with very few people because the conditions are harsh and fresh water is very sparse and not available. Many of these lakes up here are brackish water.

Uniview cues
Custom Events:
3.1 Asia: Jump to position over Asia.
Click on planetFXtoggle to make sure that the Earth is visible, since we are on the nighttime side.
Scene 3.15, frame 1
Scene 3.15

Monsoons and River Drainages

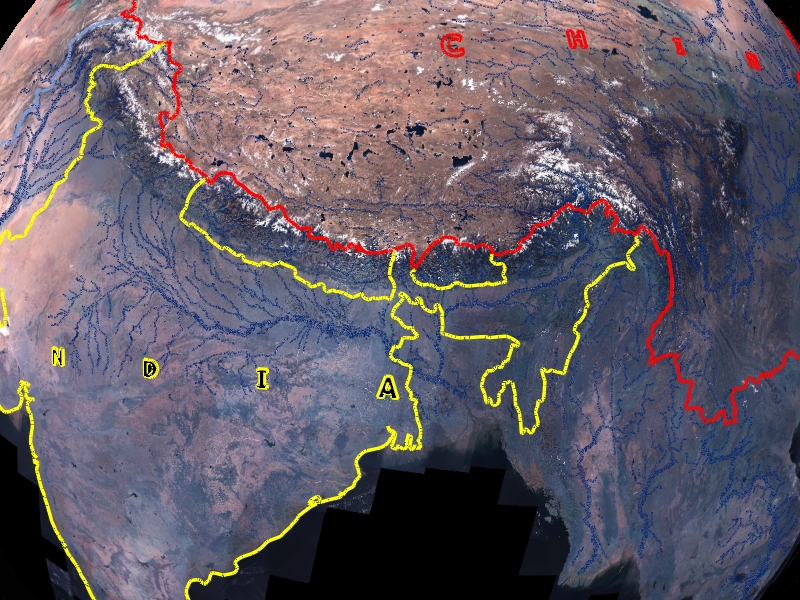
The mountain tops are highlighted by white snow. The warm moisture laden air comes off the Indian Ocean in a monsoonal pattern and crosses the Indian subcontinent. As that moist air cools it rains and as those moist air bodies move up towards the north they produce snow on the Himalayan mountains. The snowpack is the water storage and it feeds some of the major river systems in the world that have their sources in the Himalayas. The Indus river drains down through Pakistan down through Karachi. The Ganges river system has tributaries flowing across the Ganges plain out to the Indian Ocean. The Brahmaputra river shows up in orange which comes across the northern part of the Himalayas, flips around comes down through India and joins the Ganges and drains into the Indian Ocean. Then we also have the major rivers of China: the Yangtze river system and the Yellow river system that have headwaters up in the easternmost part of the massifs.

Huge numbers of people, in excess of 1.2 billion people, in the subcontinent, in excess of 1.3 billion people in China live in these drainages that come off the Himalayas.

Uniview cues
Geoscope:
Toggle Himalayan_Streams.kmz for all streams from rivers originating from Himalayas.
Toggle Basin_Ganges.kmz for basin boundary for Ganges River.
Toggle Ganges021.kmz for Ganges River streams.
Toggle Basin_Brahmaputra.kmz for basin boundary for Brahmaputra River.
Toggle Brahmaputra021.kmz for Brahmaputra River streams.
Toggle Basin_Indus.kmz for basin boundary for Indus River.
Toggle Indus021.kmz for Indus River streams.
Toggle Yellow021.kmz for Yellow River streams.
Toggle Yangtze021.kmz for Yangtze River streams.
Scene 3.20, frame 1Scene 3.20, frame 2
Scene 3.20

Landing at Everest

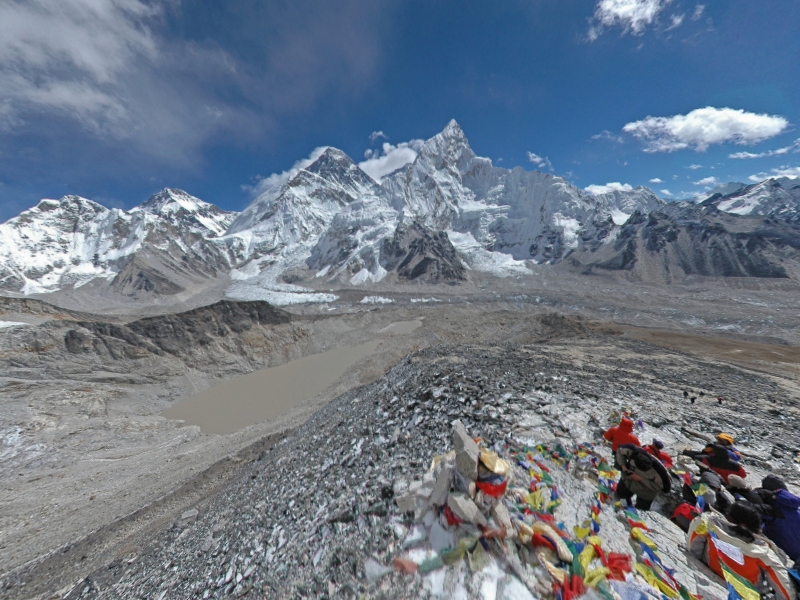
We are standing at the foot of Mt Everest, and its adjacent high peaks. You can see the glacial masses literally pouring off these mountains, coming down to the foot of the mountains and they are actually melting. You can see the water pools at the foot of the glaciers and these are some of the headwaters of some of the river systems that we have been talking about.

Not just here but worldwide, the glaciers are shrinking as it gets warmer. The high mountains are not really affected above certain levels but lower parts of the mountains are starting to feel the effect of warming. Historical photographs taken over the last 50–60 years show not only retreat of the noses of these glaciers, but their dramatic deflating effectively as they melt and lose mass. So as the world warms we lose some of our stockpile of fresh water that has been frozen in the mountain massifs. Here in the case of the Himalayas not terribly significant in the near term because there is an awful lot of ice up there. But if you go to the Andes Mountains in South America, there are serious issues with the melting of the glaciers that are providing the drinking water for cities like Lima, Peru and La Paz, Bolivia.

Uniview cues
Object Tree:
Earth→Tito Dupret→Kala Patthar (pm-120-17) to turn on Everest panorama if it is toggled off.
Custom Events:
3.2 Everest0: fly to surface.
3.2 Everest1: fly into panorama.
Sources

Panoramic image provided by World Heritage Tours, copyright Tito Dupret.

Kala Patthar Everest Panorama PNG

World Heritage Tours

Scene 3.30, frame 1Scene 3.30, frame 2
Scene 3.30

Sahara Desert

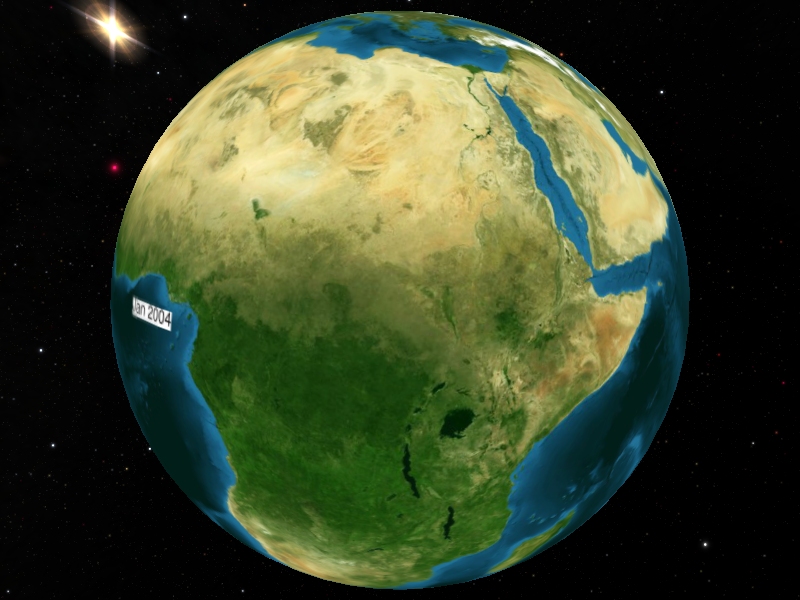
As we cross western Asia into the Middle East and northern Africa, note how dry it is in this area, including Afghanistan, Iran, southern Kazakhstan, Iraq, Saudi Arabia, the Emirates, and in Oman. These are areas that are brightly colored because they are reflecting solar radiation, and there is little or no vegetation to absorb it. The water distribution in these areas is extremely localized. For example, the Nile River is the source of water for Egypt. It has its headwaters in the Ethiopian plateau with the Blue Nile providing the lion's share of the water. The Blue Nile flows down, meets the White Nile at Khartoum and then they flow together with almost no tributaries whatsoever into the nation of Egypt where it provides the sole source of water for 80 million people.

The challenge that the people face in these countries is that their demand for water is going up as their populations go up and their supply of water is relatively limited and finite. The countries of Ethiopia and Somalia are in the Horn of Africa. This is a land that is harsh. and dry. The people live by agriculture and by fishing. There is a finite water supply on land. There is finite fish in the sea and a lot has been caught by foreign trawlers and deep marine fishing vessels. These are the people that have turned to piracy as a way of making a living and the people from Somali have emanated from the east coast and captured ships as far away as the Pakistani coast up to the north and Madagascar to the south. The lifestyle of the people in these regions that we are looking at is impacted strongly by the availability of resources, in this case water on land and fish off-shore.

Uniview cues
Geoscope:
Toggle between
bluemarble_200401
bluemarble_200407
Geoscope:
gfdl_precip_2081-2100
Sources

Blue Marble Next Generation

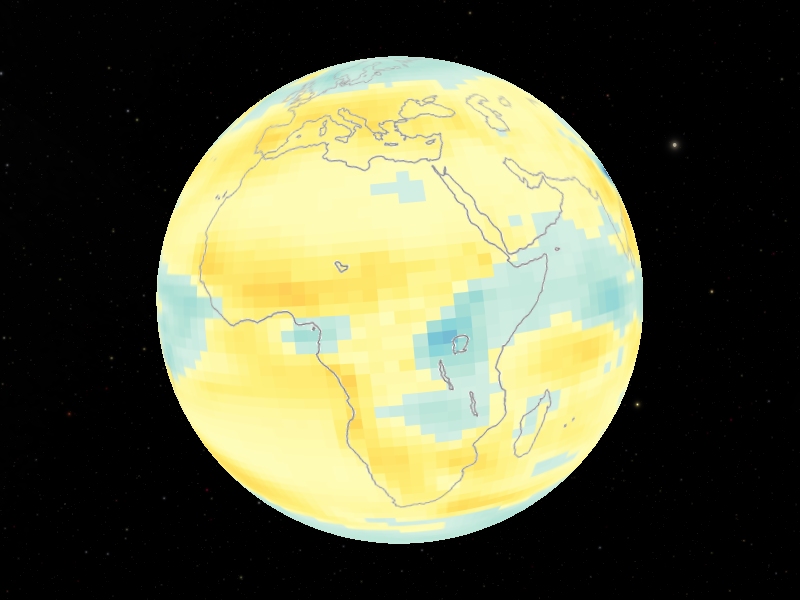
GFDL CM2.1 model (using IPCC SRES A1B scenario where CO2 levels increase from 370 to 717 ppm) showing 20-year average precipitation projected for 2081-2100 minus the 1951-2000 fifty year average. Blue areas are projected to see an increase in annual precipitation amounts; brown areas are projected to receive less precipitation in the future. Prepared by Ned Gardiner.

bluemarble_nextgen_200401.kmz

bluemarble_nextgen_200407.kmz

gfdl_precip_anomaly_2081-2100.kmz

Blue Marble Next Generation

Scene 3.32, frame 1Scene 3.32, frame 2
Scene 3.32

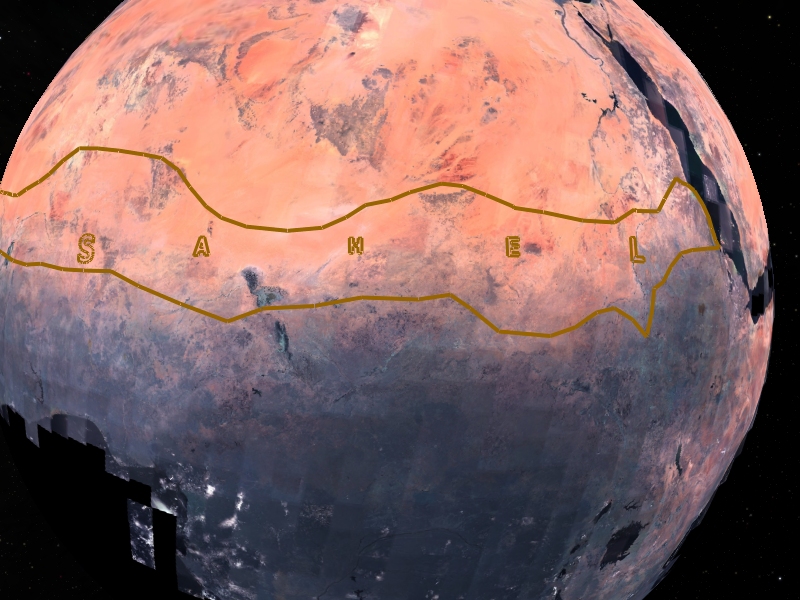
Sahel: Seasonal rainfall, vegetation as proxy

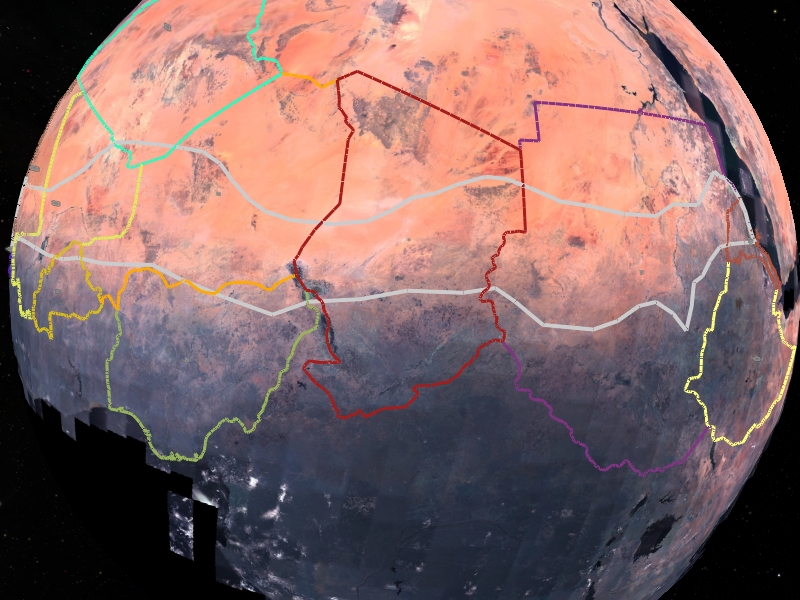
The Sahara desert forms the bulk of northern Africa and the Congo basin, a green and vegetated area, forms the bulk of central Africa. The transition between dry in the north and wet in the south is often call the Sahel. It represents the southern fringe of the Sahara desert. The Sahara has been expanding through time. There is 22 million people that live in the vicinity of Lake Chad and the broader area.

These people are struggling as it gets dryer. One of the things happening as the world gets warms is the areas that are dry are getting dryer. Some of the areas that are wet tend to get wetter but the drier zones are anticipated and shown by computer models to get increasingly dry. Here is a computer model illustrating with yellow color the areas that are going to get drier by the year 2100. You can see there might be some additional moisture in the central African rift valley lakes area around Lake Victoria, but much of the Middle East, much of the Sahel area of southern Sahara are anticipated to get dryer.

Uniview cues
Geoscope:
TEXT_Sahel.kml
BORDER_Sahel.kml
Sahel_Countries_Border.kml
Sources
Scene 3.34

Darfur, Lake Chad

This is an area that is not very industrialized. There are two different lifestyles. The sedentary people try to farm or fish in Lake Chad. These people stay put and grow crops. Other people live nomadic existences: herders with sheep, cattle, or camels. The nomadic people live a very different lifestyle than the sedentary people. One of the causes for conflict in the Darfur area, in southern Sudan, is the conflict between the sedentary people and the nomadic people. When there is abundant rainfall and abundant vegetation, farmers can grow their crops just fine and the herders can herd their animals which graze on the hillsides. But as it gets drier, the herded animals are tempted to chew on the shrubbery in the fields. So there is conflict in the lifestyle of the nomadic people and the sedentary people. There are other issues as well that we do not want to oversimplify. These include culture, religion, and tribal issues in Darfur. But if it would just rain more, some of the problems that the people face in Somalia, Ethiopia, Darfur, and central Chad would be alleviated.

In Ethiopia in the 1970s, there were famines and people would often go to a refugee camp nearby. A lot of them would suffer and often die in place. That is not happening as much. People are more connected, via cell phones, the Internet, and social media. People are moving now, whereas before they may have been unable to extract themselves from difficult conditions. Today these people are migrating, with broad scale migration happening out of these areas of hardship where there is inadequate water supplies into areas where there is more water. People are moving away from the dry areas towards the wetter areas. This brings with it a variety of conflict as you can imagine. The distribution of water in this part of the world critically controls people's lives. We are going to see more of that.

Uniview cues
Geoscope:
LAKE_Chad.kml
Scene 3.40, frame 1
Scene 3.40

Middle East: Land Use

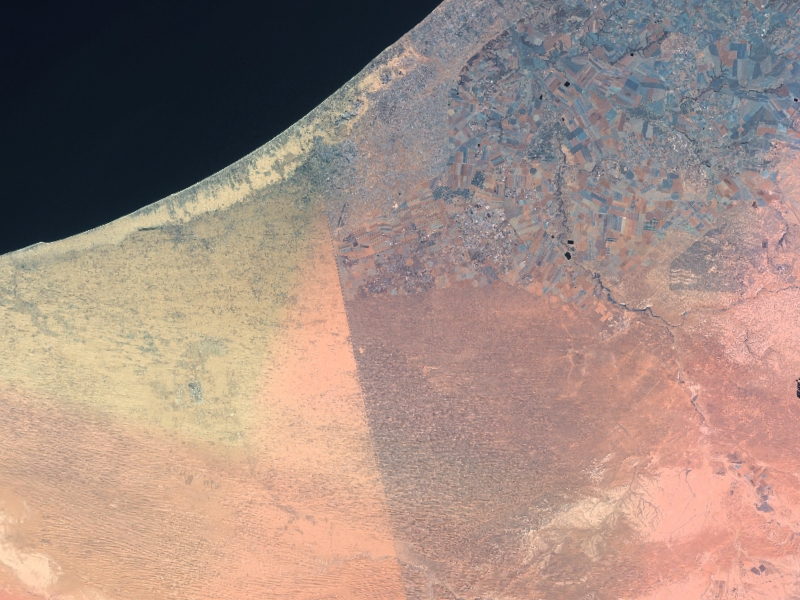
Here is the border between Egypt and Israel, with the Sinai peninsula of Egypt on the left and the Negev desert of southern Israel on the right. There is a fence on the border: You can stand on one side of the fence and look across. On the ground you can hardly see a difference but from space you can really see a stark difference, due to grazing differences. The Bedouin people in the Sinai in Egypt have goats and they graze very heavily. The more goats you have the wealthier you are, and the more goats you have, the more grazing there is. You graze to a point where there is hardly any vegetation left. However if you cross the fence, there is a very different lifestyle with mechanized agriculture, where much of the population are urban people, and where technology is being used to maximize the water – a point we will come back to at the end of the presentation. You can see from space the fundamental difference in the reflectivity of the earth's surface associate with land use practices.

Uniview cues
Geoscope:
COUNTRIES_Sinai.kml: to turn on Egypt and Israel borders.
Uniview Controls:
Fly to the Egypt-Israel border in the Sinai Peninsula.
Sources

Country borders from KMLfactbook.org.

COUNTRIES_Sinai.kml

KMLfactbook.org

Scene 3.50, frame 1
Scene 3.50

North American Rainfall

As we cross the Atlantic Ocean, patterns in North America on a continental scale set the stage for our later analysis of our own region. The North American continent is relatively bright in the west and relatively darker in the east. The eastern area is vegetated and is green. In the west there is vegetation, mostly on the high mountains. The Colorado plateau, much of Nevada, Southern California, and Northern Mexico are very arid with colors that are not unlike colors we just saw in the Sahara desert.

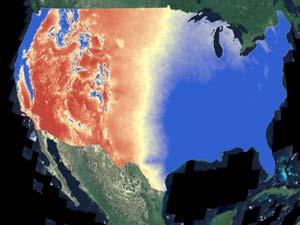
In the rainfall map, the blues represent high rainfall and the reds and yellows represent low rainfall. We use this just to stress the fact there are really two halves to the continental United States. The eastern side tends to be relatively wet. The part from the 100th meridian west tends to be relatively arid with the exception being the mountain tops. Not unlike what we saw in the Himalayas, the moist air is coming off the Pacific Ocean, comes across the western part of the US and snows heavily in the mountains, including the Yellowstone Plateau, the Wind River Mountains, the Colorado Front Range, and the San Juan Mountains.

Uniview cues
Geoscope:
PrecipNA_PRISM1971-2000v.2.kml: to turn on North American precipitation map
100west.kml to turn on 100th meridian
Sources

Derived from, US Precipitation annual average 1971 - 2000, PRISM Climate Group, Oregon State University, http://prism.oregonstate.edu, created 31 October 2008. Image created March 2011 by Lindsay Irving.

PrecipNA_PRISM1971-2000v.2.kmz

100west.kml

http://prism.oregonstate.edu

Scene 3.55

Diminished snow storage

About 80% of Colorado’s moisture is received as snowfall upon these mountain peaks. The bulk of the moisture comes in the winter time, accumulates as snow, where it is effectively stored for us. One of the challenges that we face as the climate warms is that the amount of snow is going to be diminished. We are going to get more of our fall moisture as rainfall. Our late winter moisture and spring is going to come as rainfall. There is concern that the snow is going to melt more rapidly as it gets warmer. The computer models suggest that there is going to be less surface water available in the river systems because of increased evaporation. These models suggest we could see a 10%-15% diminution of water in the Colorado river system.

04

The Colorado River

7 scenes
Scene 4.10, frame 1
Scene 4.10

Colorado’s Water

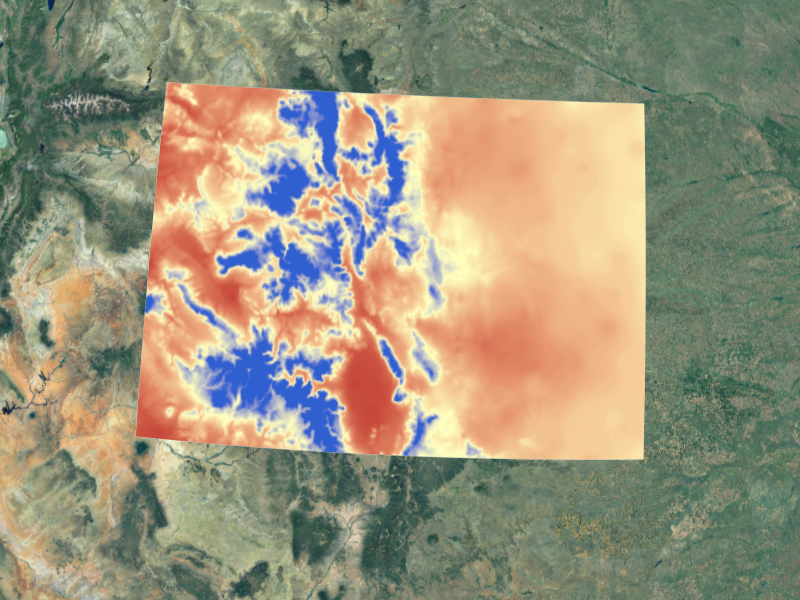
Here is the state of Colorado using the same color code where the red's are dry areas of very limited rainfall. The slightly yellowish areas are more like Denver, which gets about 14 inches of rainfall. The continental divide, the middle of the Rocky Mountains, runs through the blue regions, with the rivers to the east – the South Platte and Arkansas River systems – flowing into the Mississippi drainage to the right, and areas to west flowing into the Colorado and Gunnison river drainages to the left. The bulk of the moisture is accumulating in those high peaks, with 80% of it in Colorado falling to the west of the continental divide. The people in general live on the east side of the continental divide, along the Front Range ranging from Fort Collins in the north down to Colorado Springs and Pueblo to the south.

Uniview cues
Geoscope:
PrecipCO_PRISM1971-2000v.2.kml: to turn on Colorado precipitation map.
CO_Counties.kml to turn on county map of Colorado.
CO_Cities.kml to turn on major cities in Colorado.
CO_14ers.kml to turn on major 14,000+ foot peaks in Colorado.
Sources

Derived from, US Precipitation annual average 1971 - 2000 derived from, PRISM Climate Group, Oregon State University, http://prism.oregonstate.edu, created 31 October 2008. Image prepared by Lindsay Irving, March 2011.

PrecipCO_PRISM1971-2000v.2.kmz

Colorado borders and places KMLs:

CO_Counties.kml

CO_Cities.kml

CO_14ers.kml

http://prism.oregonstate.edu

Scene 4.20, frame 1
Scene 4.20

The Colorado River System

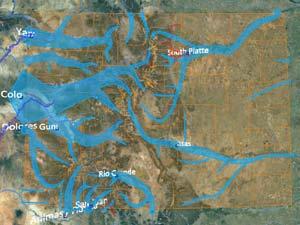
The Colorado River has its source in the snowpack in Colorado, and flows from a water rich state to water poor ones. Although the users span municipalities (8%), industry, recreation, and ecosystem services, most of the water (86%) in Colorado is used for irrigation in agriculture.

Uniview cues
Geoscope:
riogrande_watershed_streams.kml to turn on Rio Grande streams.
platte_watershed_streams.kml to turn on South and North Platte Rivers streams.
arkansas_watershed_streams.kml to turn on Arkansas River streams.
co_riverbasin_0.5-500cms.kml to turn on Colorado River basin streams.
CO_headwater_rivers.kml to turn on only the largest streams for the rivers originating from Colorado.
Colorado_Rivers_Stream_Flows.kml or CO_Simplified_StreamFlows.kml to turn on arrows showing stream flows of rivers leaving Colorado.
Sources

Based on Colorado Historic Average Annual Stream Flows map, prepared by the Hydrographic Branch, Office of the State Engineer, Colorado Division of Water Resources. Prepared by Ka Chun Yu.

Watersheds:

riogrande_watershed_streams.kml

platte_watershed_streams.kml

arkansas_watershed_streams.kml

CO_headwater_rivers.kml

CO_WATER_FLOWS:

Colorado_Rivers_Stream_Flows.kml

CO_Simplified_StreamFlows.kml

Scene 4.30, frame 1
Scene 4.30

Water Infrastructure

Here we see the regional infrastructure that has been built up to move water from where it falls west of the continental divide to where the majority of the people live, east of the divide. These regional trans-mountain diversions include reservoirs, canals and pipes running over and through the mountains.

Uniview cues
Geoscope:
natgeo_WaterInfrastructure.kml to turn on man-made pipes and canals within the Colorado River Basin.
co_river_basin_canal_names.kml to turn on names of man-made pipes and canals.
Sources
Scene 4.40, frame 1Scene 4.40, frame 2Scene 4.40, frame 3
Scene 4.40

Diminishing Flows in the Colorado River

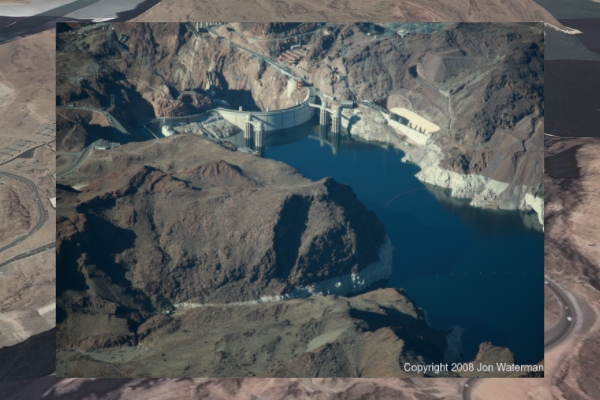
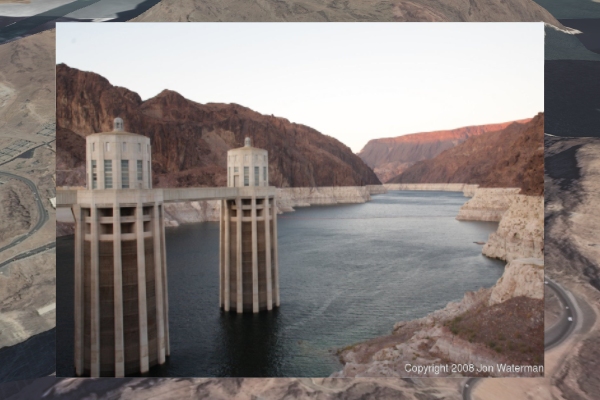
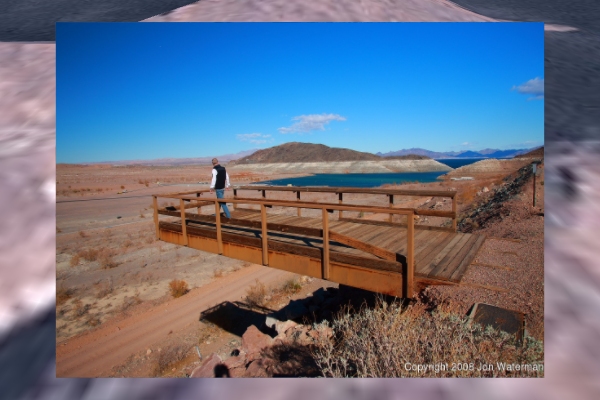
We store the water in the Colorado river system in two huge reservoirs: Lake Powell in Southern Utah and Lake Mead in Arizona and parts of Nevada. These reservoirs were designed to hold the water and they are hydro-electric projects. The water they hold is precious water: it comes from Colorado but we share it with those downstream states. The Colorado River compact was established based on flow patterns which has been measured at Lee’s Ferry for many years. The volume appears to be diminishing through time and NOAA researchers suggest we have passed peak water in the Colorado River system. The flow rates, which are noisy, vary from year to year, but as you average them though time there is a gradual diminishing of water coming into the reservoirs. The consequence is that the water levels have fallen. If you have been to Lake Powell or Lake Mead recently, you will see a bathtub ring around these reservoirs. This is a picture of Hoover Dam which is located near Las Vegas. You can see a white stripe around the reservoir that is Lake Mead. That is where the water used to be. The city of Las Vegas is drilling a new tunnel to get water out of Lake Mead. People will come out to the dock to look for their boat and all they will see is sage brush.

Uniview cues
Custom Events:
4.4 FlyTo LM to fly to point above Hoover Dam and Lake Mead.
4.4 Hoover to turn on Hoover Dam picture.
4.4 Bathtub to turn on bathtub ring close-up at Hoover Dam picture.
4.4 Dock to turn on dock to nowhere picture.
ALL Slides OFF to turn off picture.
Scene 4.45, frame 1
Scene 4.45

Lake Mead: Reservoir Volume vs. Demand

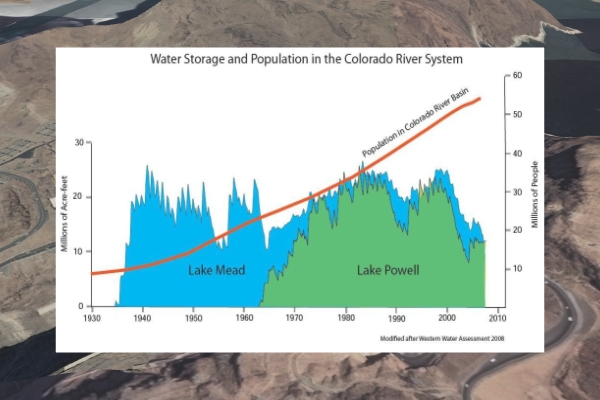
This graph shows the volume contained in those lakes. In the late 1930s we built the Hoover Dam , and filled Lake Mead up. There are variations from year to year, but you can see starting back in 1990 the year 2000, there was a long series of drier years, culminating in the drought of 2002. In this graph, we see an increasing demand for water shown as the red line, due to not only from intrinsic population growth in the Colorado River basin, but also from new people moving in. The demand is going up at the same time that the water is tending to go down. From our climate models, we are going to see increases in drying in dry areas in the Southwest just like in the Sahara.

Uniview cues
Custom Events:
4.4 Mead-Powell to turn on Lake Mead and Lake Powell water volume graph.
ALL Slides OFF to turn off picture.
Sources

Plot of reservoir volumes derived from data from Western Water Assessment. Prepared by Bob Raynolds

mead_powell_storage_1935_2008.png

Scene 4.50, frame 1
Scene 4.50

Lower Colorado River Basin

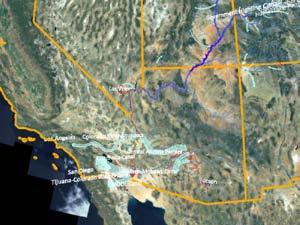
At the regional scale, the Colorado River goes down to the Gulf of California. The network of red lines are the artificial canal systems that we have built. The Central Arizona Project brings water to Tucson, and a whole system of canals bring water over to the Los Angeles basin area. The Salton Sea is actually Colorado River water that spilled into a trough. These are areas that have become agriculturally wonderful. Cities have been built based on our engineering and our ability to move water. We are doing something similar to what the Romans did with their aqueducts: we are building a huge canal network here to move water out of the Colorado River to allow the habitable zone to spread into areas like Tucson and Los Angeles. These are areas that wouldn’t have the lifestyles we are accustomed to if we didn’t have the water, and weren’t able to move the water.

Uniview cues
Geoscope:
co_riverbasin_0.5-500cms.kml to turn on Colorado River basin streams.
natgeo_WaterInfrastructure.kml to turn on man-made pipes and canals within the Colorado River Basin.
co_river_basin_canal_names.kml to turn on names of man-made pipes and canals.
co_riverbasin_boundary.kml to turn on boundary of Colorado River basin.
CO_RiverBasin_Water_Names.kml to turn on names of water features.
CO_RiverBasin_States.kml to turn on outlines of seven states.
CO_RiverBasin_Cities.kml to turn on positions of major cities.
Scene 4.60, frame 1
Scene 4.60

CAP Canals

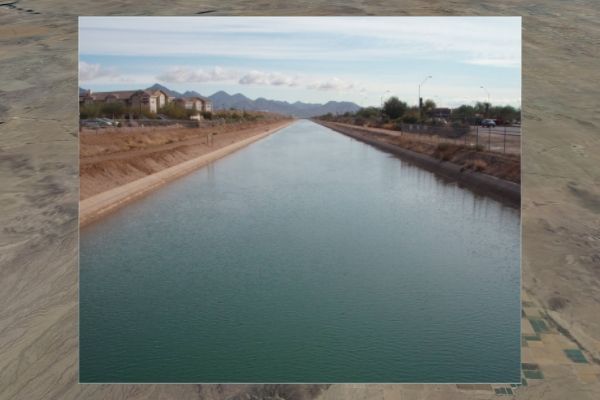
This picture is of the Central Arizona Project (CAP), taken at the northern edge of Scottsdale at the edge of Phoenix. It shows that the CAP is a huge open ditch that moves water across the torrid desert, and of course is losing water through evaporation. It’s built as an open ditch because that was the least expensive way to move the water. It may someday come to pass they will cover it and save the evaporation. But right now we are using the water relatively inefficiently. Those of you that are familiar with the cities of Arizona know that we have built them in the desert, with golf courses, artificial ponds, and reservoirs. Some of the water is used extravagantly in some of these areas.

Uniview cues
Custom Events:
4.6 FlyTo BT to fly to CAP canal bookmark.
4.6 CAP to turn on CAP canal picture.
ALL Slides OFF to turn off picture.
Sources

Photograph by Bob Raynolds

CAP_canal_Scottsdale.png

05

State of Colorado Water

7 scenes
Scene 5.10, frame 1
Scene 5.10

Colorado Big Thompson Project

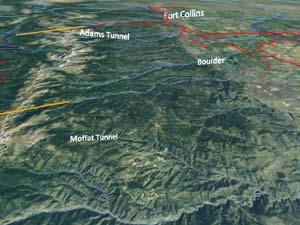
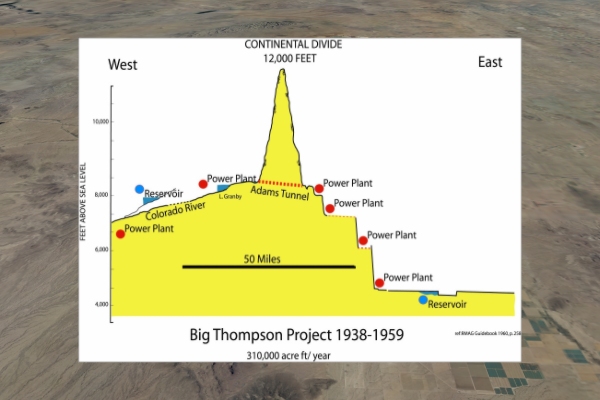
Back in Colorado, the headwaters of the Colorado river system are up in Rocky Mountain National Park. One of the things we have done is that we have tunnels that bring the Colorado river water underneath the continental divide to the Front Range, including a tunnel system that comes from Grand Lake and Granby, across and underneath Rocky Mountain National Park. A cross sectional view shows the Granby and Grand Lakes to the west, and the Adams tunnel through the continental divide. This Big Thompson Project was built in the 1940s-1950s, and allowed for the growing of sugar beets in Greeley, and helped establish many of the communities on the front range from Fort Collins down to the area north of Denver.

Uniview cues
Custom Events:
5.1 FlyTo BT to fly to Big Thompson Project bookmark.
5.1 Big Thompson to turn on Big Thompson Project cross-section picture.
ALL Slides OFF to turn off picture.
Sources

Graphic by Bob Raynolds

co_bigThompsonProject.png

Scene 5.20, frame 1
Scene 5.20

Panorama of Pipes

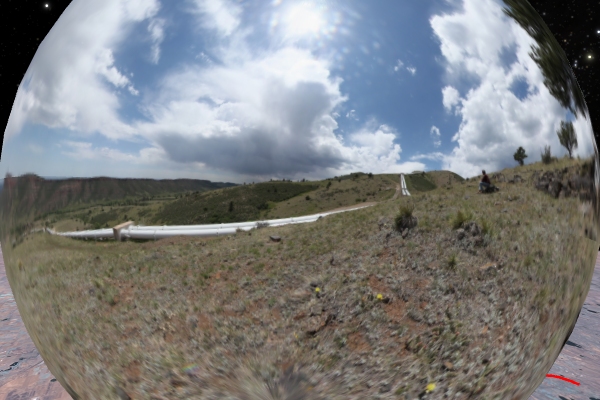
This panorama is a photo of the tunnel system north of Longmont near Carter Lake. A pair of pipes, each about 5 feet in diameter, comes out of the mountains dropping Colorado River water to the bottom of the hill here where there is a power station that generates hydro-electricity. It then drops down to Horsetooth reservoir, then towards Carter Lake, and then ultimately out to the high plains. Originally used for growing sugar beets, the water is now divided between municipal (over 51%) and agricultural use.

Uniview cues
Object Tree:
Earth→DMNS-Ka Chun Yu→Big Thompson Project→Pipes 3
Uniview Controls:
Toggle on panorama, then lock camera and zoom into it (or perform a Fly To).
Sources
Scene 5.30, frame 1Scene 5.30, frame 2Scene 5.30, frame 3
Scene 5.30

Historic vs. Present Day Westminster, CO

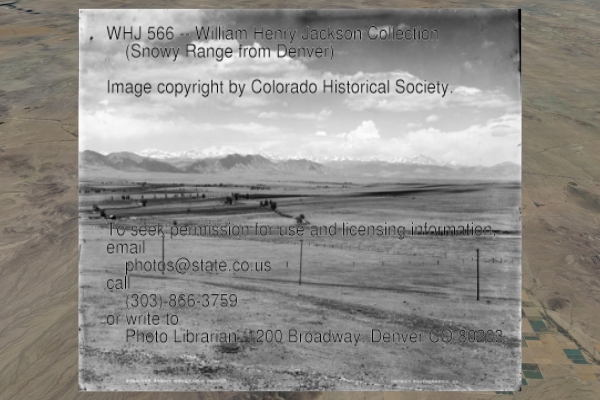
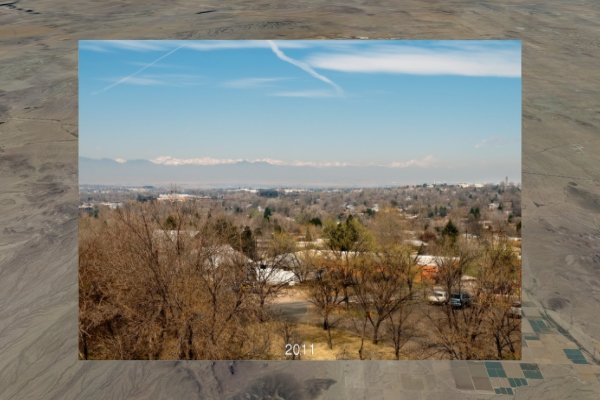
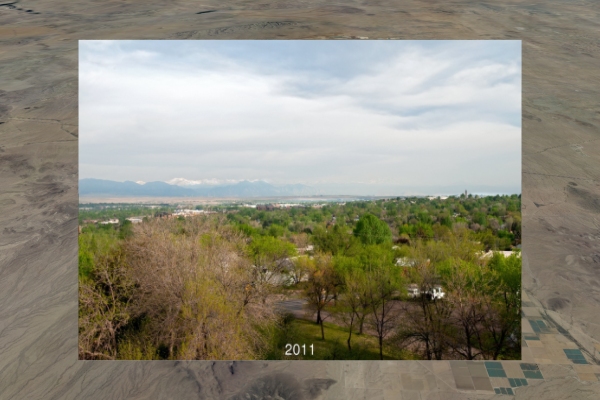
The first picture looking north towards Westminster, was taken in 1892, when there wasn’t much there, except for a few cottonwoods on the valley floor. The second picture was taken in 2011. Look at the change: we built a city, developed homes, schools, businesses, industries, all predicated on the use of water that is brought in large part from the other side of the continental divide from the Colorado River system. Even in Denver, about 50% of the water is Colorado River water.

Uniview cues
Custom Events:
5.3 FlyTo West to fly to Westminster/Denver Basin bookmark.
5.3 WH Jackson to turn on W.H. Jackson’s 1892 image of Westminster, CO.
5.3 WestminsterA to turn on first 2011 image of Westminster, CO.
5.3 WestminsterB to turn on second 2011 image of Westminster, CO.
ALL Slides OFF to turn off picture.
Sources

1892 image (WHJ 566 from the William Henry Jackson Collection, “Snowy Range from Denver”) copyright by Colorado Historical Society. To seek permission for use and licensing information, email photos@state.co.us, call (303) 866-3759, or write to Photo Librarian, 1200 Broadway, Denver CO 80203.

Present-day (2011) photography by Ka Chun Yu.

W.H. Jackson 1892 image

westminster_2011_04_08_annot.jpg

westminster_2011_05_17_annot.jpg

Colorado Historical Society

Scene 5.40, frame 1Scene 5.40, frame 2Scene 5.40, frame 3
Scene 5.40

Effective Agriculture Actions

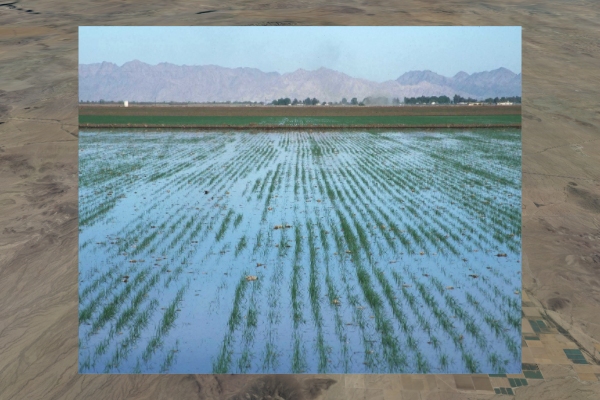
The vast majority of the water – about 86% -- in Colorado is used for irrigation. These slides first show furrow irrigation or field irrigation. Often practiced in many places where there is abundant water supply, field irrigation is where water is just placed in the field. Crops like corn are grown using this method in Boulder County. Some could argue that maybe corn shouldn’t be grown in Boulder county.

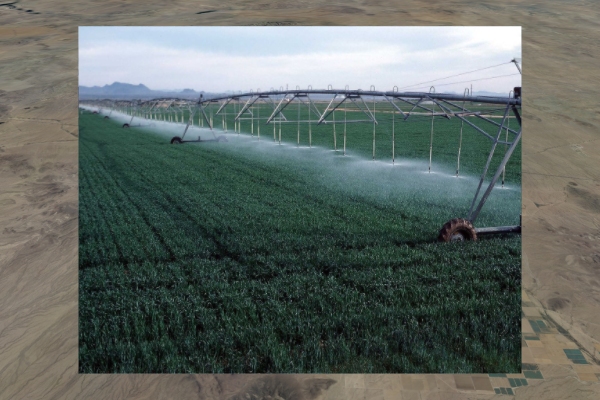
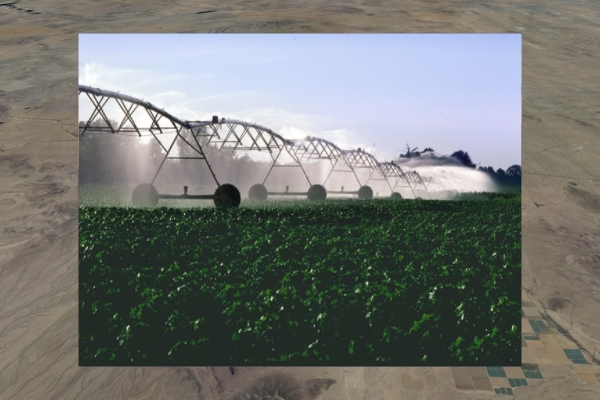
Next is a center pivot system. It is spraying water from a height onto the fields and this is a very water intensive way of irrigating because a lot of the water evaporates. In a dry or desert area, if you spray the water from 6 or 8 feet high, a lot of the water evaporates before it gets to the ground.

The scene has been improved on in the final picture. You see a center pivot system with these hoses hanging down. Considerable water saving can happen using this technology, and is happening using this technology. County extension agencies in these areas can also use satellite images, like we are showing you today, to look at fields and even a portion of a field to identify the drier areas. They give advice to the farmers to tell them how much water to put on which part of the field. As we get more effective in our usage of technology we can use our water supplies more effectively and more carefully to still produce crops and grow our food.

Uniview cues
Custom Events:
5.4 Flood to turn on picture of flood irrigation.
5.4 Center Pivot to turn on picture of center pivot irrigation.
5.4 Pivot Drop to turn on picture of center pivot with drop irrigation.
ALL Slides OFF to turn off picture.
Sources

Flood irrigation photo credit: Level basin flood irrigation on wheat. Yuma, Az. 2002 Photo by Jeff Vanuga, USDA Natural Resources Conservation Service Source: http://photogallery.nrcs.usda.gov/Index.asp

USDA

Center pivot photo credit: Pivot irrigation on cotton; originally http://www.usda.gov/oc/photo/ USDA

Center pivot with drops photo credit: Center pivot irrigation on wheat growing in Yuma County, Colorado. 1987. photogallery.nrcs.usda.gov; No. NRCSCO87001

http://commons.wikimedia.org/wiki/File:LevelBasinFloodIrrigation.JPG

http://commons.wikimedia.org/wiki/File:PivotIrrigationOnCotton.jpg

http://commons.wikimedia.org/wiki/File:PivotWithDrops.JPG

http://photogallery.nrcs.usda.gov/Index.asp

http://www.usda.gov/oc/photo/

photogallery.nrcs.usda.gov

No. NRCSCO87001

Scene 5.50, frame 1
Scene 5.50

Recycled Water at City Park

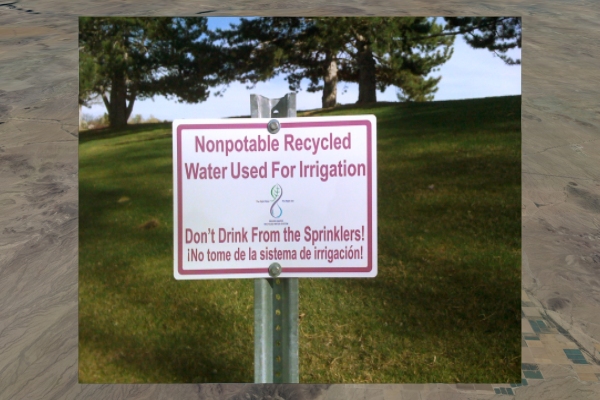
Another thing happening is in City Park outside the Denver Museum of Nature & Science. Here is a sign illustrating that City Park is now irrigated with water that has been recycled. It comes in purple pipes and it isn’t potable, meaning it has been treated but not treated and chlorinated to a standard that is drinkable. You would probably be all right if you drank a little bit of it but it's not designed for common drinking. It’s carried in a separate set of pipe systems than potable water. Even DMNS has changed its fixtures: the restrooms have low flush toilets, and the water in the sinks only comes on when you put your hands in the sink. About 25% of the water usage at DMNS has been saved by implementing a better technology in the restrooms.

Uniview cues
Custom Events:
5.5 City Park to turn on picture of City Park sign.
ALL Slides OFF to turn off picture.
Sources

Photograph by Ka Chun Yu

cityPark_irrigationSign.jpg

Scene 5.60, frame 1Scene 5.60, frame 2Scene 5.60, frame 3Scene 5.60, frame 4
Scene 5.60

Middle East Agriculture

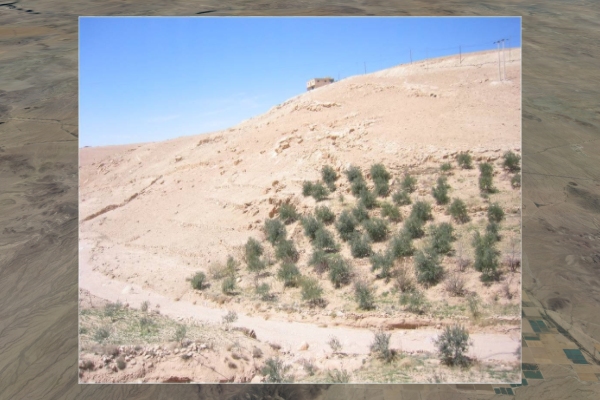
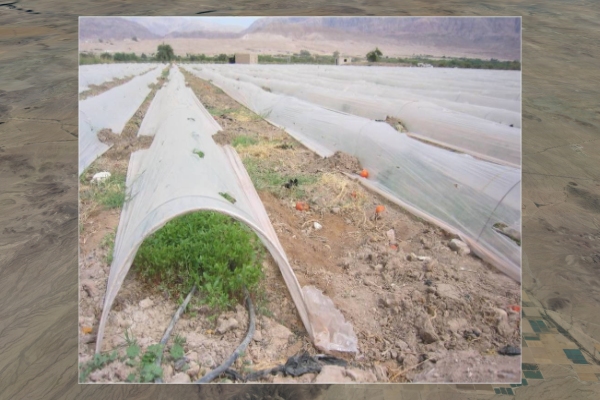
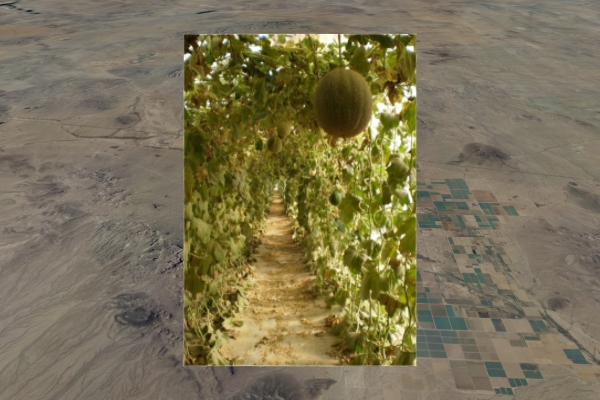
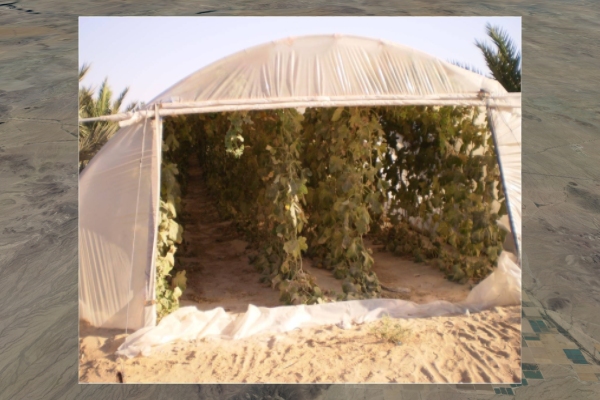
We want to emphasize that our use of technology can make significant impact on how we can handle the land surface. Here are some scenes showing irrigation in the Middle East. The first is from southern Jordan, where olive trees are being grown with drip systems on a land that otherwise is barren. A little dripper attached to each tree enables you to grow olives in the desert. Tomatoes are grown under little Quonset huts, which are 8-10 inch high plastic domes, where a pipe system brings the water in. In the margins of the Dead Sea, an extremely arid place, tomatoes are being grown. Next is a scene from the Negev desert in southern Israel. A larger greenhouse with a plastic roof, plastic walls, plastic floor, and the water come in a series a pipes underground to each of these vines. If you walk into this greenhouse, you hit your head on melons growing from the roof. The Negev desert is a place that is so dry, it’s shocking. You couldn’t find two sticks to make tea, yet they are growing melons that hit you on the head by using water more effectively.

Some of these technologies that are being developed in the Middle East and other parts of the world will be used here. It’s already happening: you can go to the irrigation stores along the Front Range and buy drip systems that come from some of these water challenged countries.

Uniview cues
Custom Events:
5.6 Olive Trees to turn on picture of olive trees.
5.6 Rows to turn on picture of rows of plastic greenhouses.
5.6 Greenhouse to turn on picture of large greenhouse.
5.6 Melons to turn on picture of melons inside large greenhouse.
ALL Slides OFF to turn off picture.
Sources

Photographs by Bob Raynolds

middle_east_bob_raynolds_pics.zip

Scene 5.70, frame 1Scene 5.70, frame 2Scene 5.70, frame 3
Scene 5.70

Holistic Management

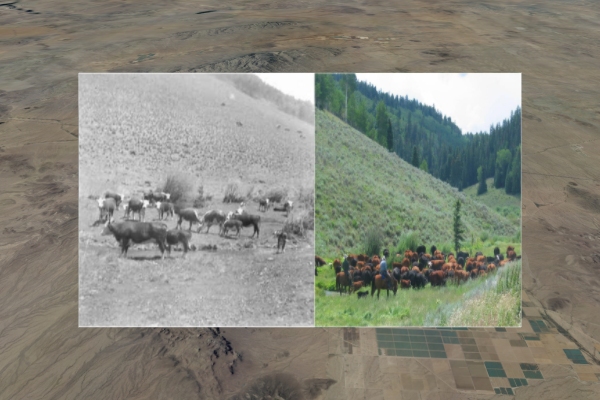
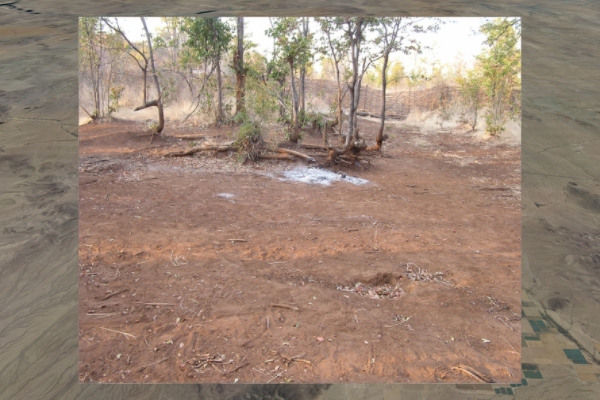
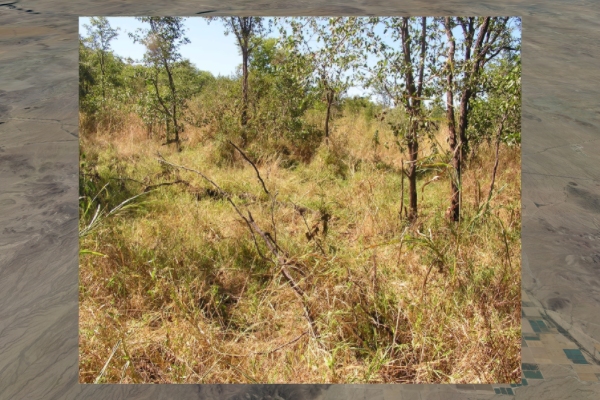
As we study the way the animals interact with the land, it is clear that we should modify the way cattle graze. In the past before people arrived in the west, large bands of herbivores traveled the landscape and grazed very intensively but very episodically. Today we typically have more cattle spread over a large area and they graze continuously often to the detriment of the grass. New ways of managing the landscape called “holistic management” have been developed by Allan Savory and his group.

Here is a scene from Zimbabwe, where cattle have been grazing in a traditional manner and have grazed the vegetation almost entirely. Now the next scene is what happens if the animals are managed more carefully, so that they are moved periodically and the land has an opportunity to recover and rest. Although both pictures appear to be totally different, they are actually the same exact scene. There are individual trees and bent branches that are the same in both images. The picture on the right shows that land can recover if the grazing animals are managed correctly. And once recovered, you can increase the number of animals that can be supported by the same land once it’s been improved.

Uniview cues
Custom Events:
5.7 SavoryCO to turn on side-by-side picture of comparison of field before and after holistic management.
5.7 SavoryAfr1 to turn on picture of field in Zimbabwe before holistic management.
5.7 SavoryAfr2 to turn on picture of field in Zimbabwe after holistic management.
ALL Slides OFF to turn off picture.
06

Conclusion

2 scenes
Scene 6.10, frame 1
Scene 6.10

We live in the Habitable Zone (situational awareness at many scales)

It is made habitable by water availability

There is enough water for all if we allocate it and use it effectively

There is a need for collaboration and education; we can learn from other arid regions like those in the Middle East.

Upstream to downstream users needs must be respected

Adaptive strategies can allow all users to share a finite water resource.

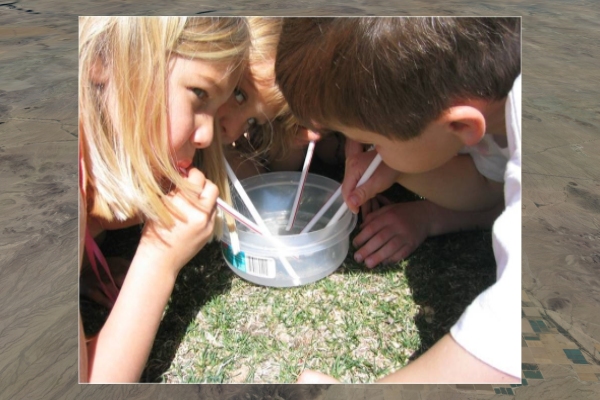
The final picture shows an experiment done on the lawn of DMNS a couple of years ago. We were trying to illustrate that there is a limited amount of water and lots of people are trying to put their straws in it. As the kids were doing this, they were delighted by the idea of the experiment, until we started to notice food particles floating around in that bucket. There was some implication of backwashing going on. But they were using the water efficiently, taking only what they needed, use what you need. They were all sharing the same water supply.

Uniview cues
Custom Events:
6.1 Straws to turn on picture of kids with straws.
Sources

Photograph by Bob Raynolds

children_with_straws.png

Scene 6.20, frame 1
Scene 6.20

End Credits

We live in a dry area. We have water challenges, but really it’s an engineering challenge. We’ve got wonderful technology. We can look at the whole ecosystem of western US and the western North America and we can put together a vision of the future. Though we recognize that it is getting warmer, and we recognize there is going to be diminished surface water supplies, we can find technological ways and we can adapt to the changes that are coming. It might not be easy; it may involve changes in the way we water our golf courses and wash our cars, things that we take for granted today. There is adequate water supplies in the area; it just needs to be used more carefully. You are going to hear anxiety as we move forward with big development projects like new sub-divisions going up in Douglas County, and a discussion about a pipeline between Pueblo Reservoir and Colorado Springs. It is going to require careful skills and careful management for educated and enlightened people to more lightly live on this landscape. But there is a land here and our children will enjoy Colorado. There will still be water for our kids and grandkids; they will just have to use it more carefully. They will also have to share it with the people that are coming to Colorado and the people that live downstream from Colorado. That sharing will involve collective wisdom and collective uses of water in more efficient fashions.

Uniview cues
Custom Events:
6.2 Credits to turn on credits slide.
§

Literacy principles addressed

1 framework

The principles from the storyboard's alignment tables, each with the sections that address it.

Climate Literacy Principles

  • 1. The Sun is the primary source of energy for Earth’s climate systemSection 1Section 3
  • A. Sunlight reaching the Earth can heat the land, ocean, and atmosphere. Some of that sunlight is reflected back to space by the surface, clouds, or ice. Much of the sunlight that reaches Earth is absorbed and warms the planet.Section 1Section 3
  • 2. Climate is regulated by complex interactions among components of the Earth systemSection 2Section 3Section 4
  • A. Earth’s climate is influenced by interactions involving the Sun, ocean, atmosphere, clouds, ice, land, and life. Climate varies by region as a result of local differences in these interactions.Section 3
  • B. Covering 70% of Earth’s surface, the ocean exerts a major control on climate by dominating Earth's energy and water cycles. It has the capacity to absorb large amounts of solar energy. Heat and water vapor are redistributed globally through density-driven ocean currents and atmospheric circulation. Changes in ocean circulation caused by tectonic movements or large influxes of fresh water from melting polar ice can lead to significant and even abrupt changes in climate, both locally and on global scales.Section 2Section 3
  • F. The interconnectedness of Earth’s systems means that a significant change in any one component of the climate system can influence the equilibrium of the entire Earth system. Positive feedback loops can amplify these effects and trigger abrupt changes in the climate system. These complex interactions may result in climate change that is more rapid and on a larger scale than projected by current climate models.Section 3Section 4
  • 3. Life on Earth depends on, is shaped by, and affects climateSection 1Section 2Section 3Section 5
  • A. Individual organisms survive within specific ranges of temperature, precipitation, humidity, and sunlight. Organisms exposed to climate conditions outside their normal range must adapt or migrate, or they will perish.Section 1Section 2
  • B. The presence of small amounts of heat-trapping greenhouse gases in the atmosphere warms Earth’s surface, resulting in a planet that sustains liquid water and life.Section 1
  • D. A range of natural records shows that the last 10,000 years have been an unusually stable period in Earth’s climate history. Modern human societies developed during this time. The agricultural, economic, and transportation systems we rely upon are vulnerable if the climate changes significantly.Section 3
  • E. Life—including microbes, plants, and animals and humans—is a major driver of the global carbon cycle and can influence global climate by modifying the chemical makeup of the atmosphere. The geologic record shows that life has significantly altered the atmosphere during Earth’s history.Section 3Section 5
  • 4. Climate varies over space and time through both natural and man-made processesSection 3Section 4
  • A. Climate is determined by the long-term pattern of temperature and precipitation averages and extremes at a location. Climate descriptions can refer to areas that are local, regional, or global in extent. Climate can be described for different time intervals, such as decades, years, seasons, months, or specific dates of the year.Section 3
  • D. Scientific observations indicate that global climate has changed in the past, is changing now, and will change in the future. The magnitude and direction of this change is not the same at all locations on Earth.Section 3Section 4
  • E. Based on evidence from tree rings, other natural records, and scientific observations made around the world, Earth’s average temperature is now warmer than it has been for at least the past 1,300 years. Average temperatures have increased markedly in the past 50 years, especially in the North Polar Region.Section 3
  • 5. Our understanding of the climate system is improved through observations, theoretical studies, and modelingSection 1Section 3
  • B. Environmental observations are the foundation for understanding the climate system. From the bottom of the ocean to the surface of the Sun, instruments on weather stations, buoys, satellites, and other platforms collect climate data. To learn about past climates, scientists use natural records, such as tree rings, ice cores, and sedimentary layers. Historical observations, such as native knowledge and personal journals, also document past climate change.Section 1
  • C. Observations, experiments, and theory are used to construct and refine computer models that represent the climate system and make predictions about its future behavior. Results from these models lead to better understanding of the linkages between the atmosphere-ocean system and climate conditions and inspire more observations and experiments. Over time, this iterative process will result in more reliable projections of future climate conditions.Section 3
  • 6. Human activities are impacting the climate systemSection 4Section 5
  • C. Human activities have affected the land, oceans, and atmosphere, and these changes have altered global climate patterns. Burning fossil fuels, releasing chemicals into the atmosphere, reducing the amount of forest cover, and rapid expansion of farming, development, and industrial activities are releasing carbon dioxide into the atmosphere and changing the balance of the climate system.Section 5
  • D. Growing evidence shows that changes in many physical and biological systems are linked to human-caused global warming.3 Some changes resulting from human activities have decreased the capacity of the environment to support various species and have substantially reduced ecosystem biodiversity and ecological resilience.Section 4
  • E. Scientists and economists predict that there will be both positive and negative impacts from global climate change. If warming exceeds 2 to 3°C (3.6 to 5.4°F) over the next century, the consequences of the negative impacts are likely to be much greater than the consequences of the positive impacts.Section 4
  • 7. Climate change will have consequences for the Earth system and human livesSection 3Section 4Section 5
  • B. Climate plays an important role in the global distribution of freshwater resources. Changing precipitation patterns and temperature conditions will alter the distribution and availability of freshwater resources, reducing reliable access to water for many people and their crops. Winter snowpack and mountain glaciers that provide water for human use are declining as a result of global warming.Section 3Section 4Section 5
  • C. Incidents of extreme weather are projected to increase as a result of climate change. Many locations will see a substantial increase in the number of heat waves they experience per year and a likely decrease in episodes of severe cold. Precipitation events are expected to become less frequent but more intense in many areas, and droughts will be more frequent and severe in areas where average precipitation is projected to decrease.Section 4Section 5
  • F. Human health and mortality rates will be affected to different degrees in specific regions of the world as a result of climate change. Although cold-related deaths are predicted to decrease, other risks are predicted to rise. The incidence and geographical range of climate-sensitive infectious diseases—such as malaria, dengue fever, and tick-borne diseases—will increase. Drought-reduced crop yields, degraded air and water quality, and increased hazards in coastal and low-lying areas will contribute to unhealthy conditions, particularly for the most vulnerable populations.Section 3Section 5